
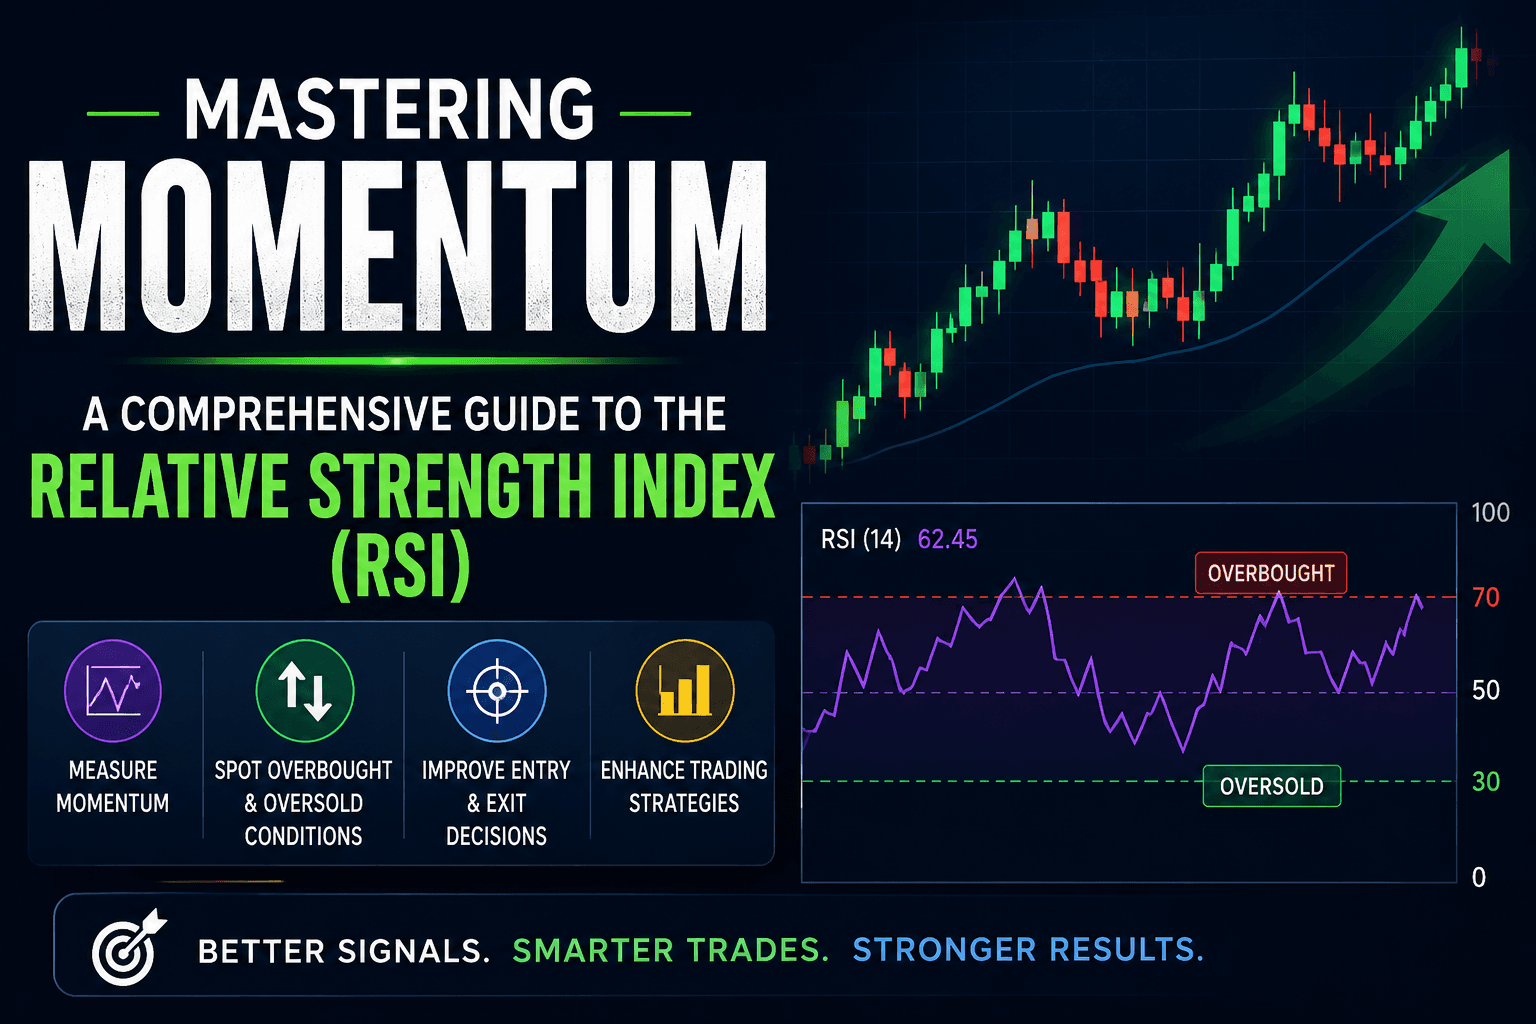
How to Master Market Momentum Using the Relative Strength Index (RSI)
Mastering Momentum: A Comprehensive Guide to the Relative Strength Index (RSI) Mastering Momentum: A Comprehensive Guide to the Relative Strength Index (RSI) Financial markets and trading analysis illustration Introduction: Understanding Momentum Before Making a Trade Technical analysis gives traders a wide range of tools for studying financial markets. Among the most widely recognized is the Relative Strength Index (RSI), a momentum oscillator designed to measure the speed and magnitude of recent price movements. For decades, traders across forex, stocks, commodities, indices and other financial markets have used RSI to help evaluate market momentum and identify conditions that may deserve closer attention. Its simplicity is one of its greatest strengths: the indicator moves between 0 and 100, making it relatively easy to interpret even for traders who are still developing their technical-analysis skills. However, simplicity can also create misunderstanding. One of the most common mistakes among newer traders is treating RSI as a mechanical buy-and-sell signal. A reading above 70 does…
 Sylvester Chepkok | SkyPress Editorial
May 15