
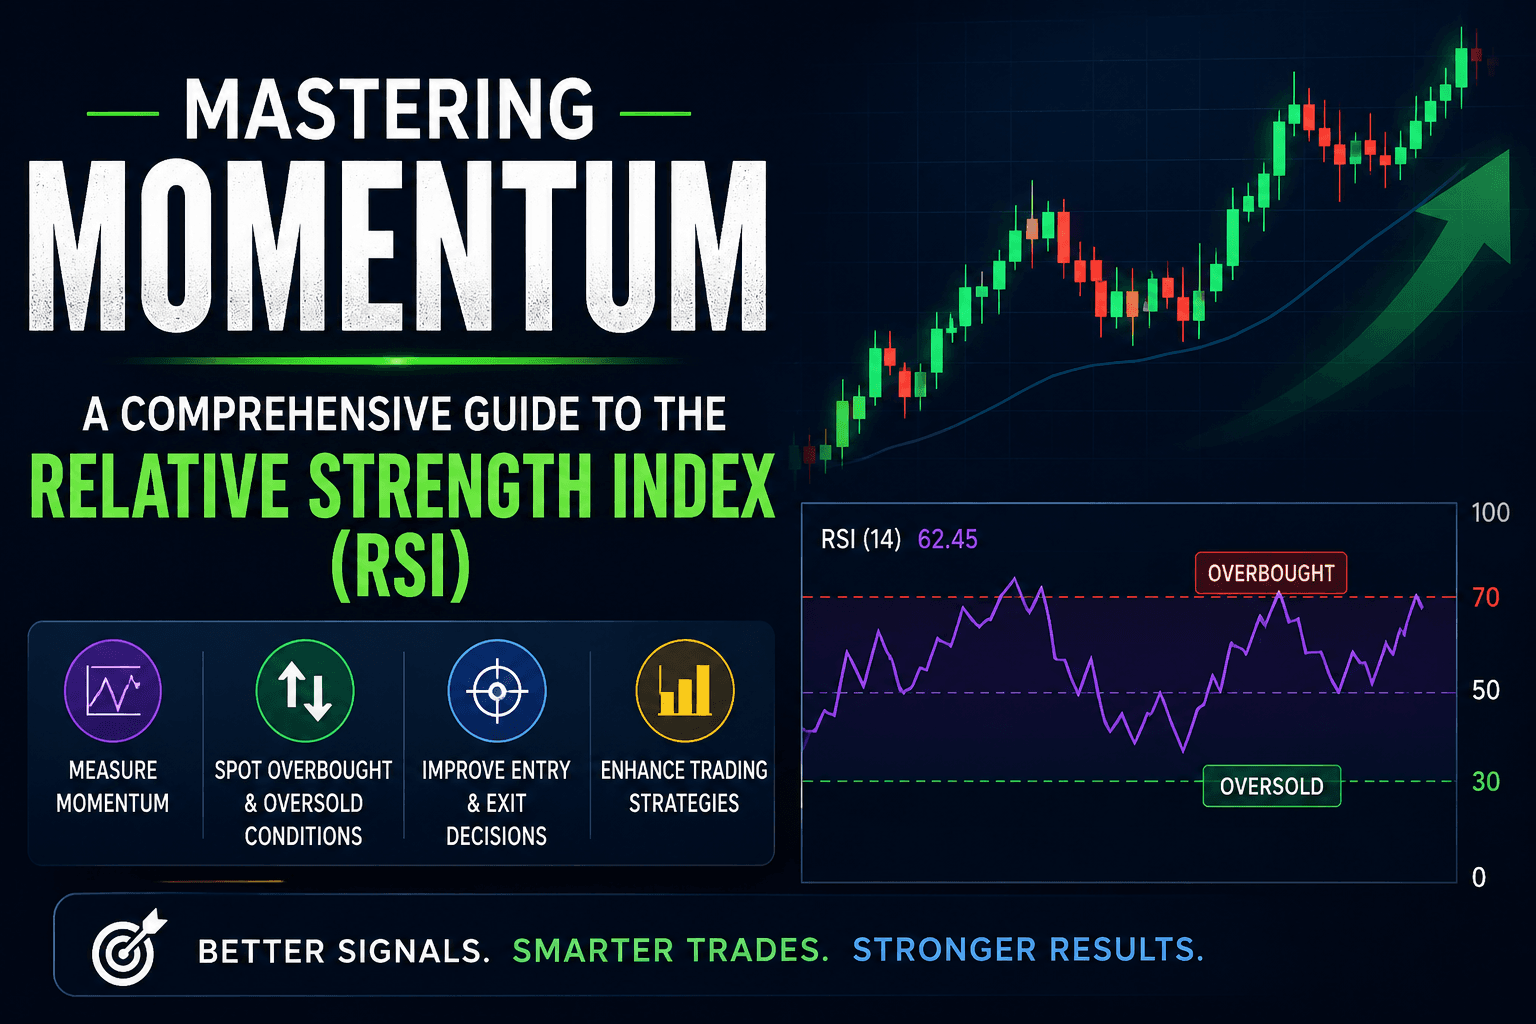
How to Master Market Momentum Using the Relative Strength Index (RSI)

Mastering Momentum: A Comprehensive Guide to the Relative Strength Index (RSI)

Introduction: Understanding Momentum Before Making a Trade
Technical analysis gives traders a wide range of tools for studying financial markets. Among the most widely recognized is the Relative Strength Index (RSI), a momentum oscillator designed to measure the speed and magnitude of recent price movements.
For decades, traders across forex, stocks, commodities, indices and other financial markets have used RSI to help evaluate market momentum and identify conditions that may deserve closer attention. Its simplicity is one of its greatest strengths: the indicator moves between 0 and 100, making it relatively easy to interpret even for traders who are still developing their technical-analysis skills.
However, simplicity can also create misunderstanding. One of the most common mistakes among newer traders is treating RSI as a mechanical buy-and-sell signal. A reading above 70 does not automatically mean that price must fall, just as a reading below 30 does not guarantee that price will immediately rise.
The more useful way to think about RSI is as a momentum and market-condition tool. It can help traders understand how aggressively price has been moving, whether momentum is strengthening or weakening, and whether price action is showing signs of potential exhaustion.
In this comprehensive guide, SkyPress explores how RSI works, how it is calculated, how traders interpret overbought and oversold conditions, how divergence can reveal changes in momentum, and how RSI can be combined with price structure and other technical tools.
What Is the Relative Strength Index?
The Relative Strength Index (RSI) is a momentum oscillator developed by J. Welles Wilder Jr. and introduced in his 1978 book, New Concepts in Technical Trading Systems.
The indicator was designed to measure the strength of recent price movements by comparing the magnitude of recent gains with recent losses. The resulting value is plotted on a scale from 0 to 100.
Because RSI responds to changes in recent price momentum, it can help traders assess whether buying or selling pressure has become unusually strong relative to the selected lookback period.
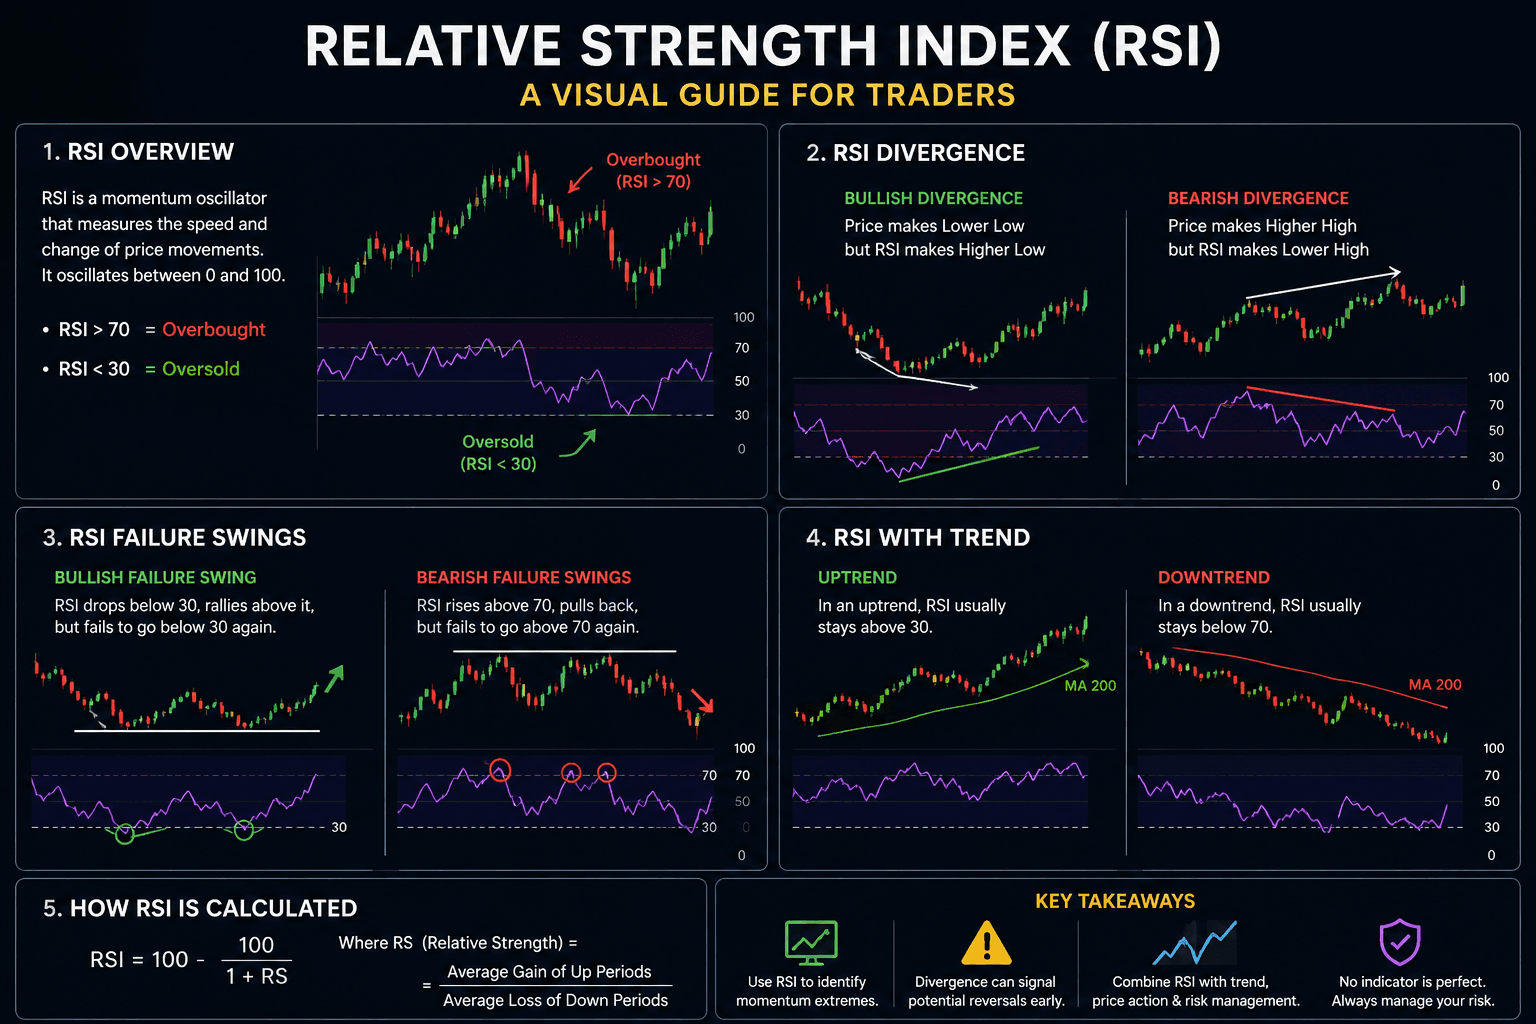
Traditionally, traders pay particular attention to three broad zones:
- Above 70: Traditionally interpreted as an overbought condition.
- Between 30 and 70: Generally considered the neutral or intermediate zone.
- Below 30: Traditionally interpreted as an oversold condition.
These thresholds are useful reference points, but they should not be interpreted as guaranteed reversal levels.
Does Overbought Mean Price Must Fall?
No. This distinction is extremely important.
When RSI moves above 70, it tells us that recent upward momentum has become strong relative to the indicator’s calculation period. It does not mean that buyers have necessarily finished buying or that a bearish reversal must occur.
During a powerful uptrend, RSI can remain above 70 for an extended period while price continues to rise. Selling simply because RSI has crossed above 70 can therefore result in repeatedly taking positions against a strong trend.
The same principle applies to oversold conditions. An RSI reading below 30 indicates strong recent downside momentum, but price can continue falling if the underlying bearish trend remains intact.
How RSI Is Calculated
Most modern trading platforms calculate RSI automatically, so traders rarely need to perform the calculation manually. Nevertheless, understanding the basic mathematics helps explain why the indicator behaves differently when its settings are changed.
The RSI formula is:
Here, RS stands for Relative Strength and represents the relationship between the average gain and average loss over the selected calculation period.
In simplified terms:
The resulting RSI value is then converted into a scale ranging from 0 to 100.
A sustained sequence of strong gains tends to push the RSI higher, while persistent losses tend to push it lower. When gains and losses become more balanced, the indicator tends to move toward the middle of its range.
The Standard 14-Period RSI Setting
The traditional RSI setting is 14 periods. The meaning of one period depends on the chart timeframe being used.
For example, on a daily chart, a 14-period RSI examines approximately 14 daily periods. On an hourly chart, it represents approximately 14 hourly periods. On a 15-minute chart, each period represents 15 minutes.
This means RSI does not have a fixed relationship with calendar time. Its calculation is tied to the timeframe of the chart.
Changing the RSI Period
Traders can adjust the RSI period depending on their objectives and trading style. However, changing the setting also changes the indicator’s sensitivity.
- Shorter periods, such as 7 or 9: The RSI becomes more responsive to recent price changes. This can produce earlier signals, but it may also create more noise and false signals.
- Standard 14-period RSI: Provides the traditional balance between responsiveness and smoothing and remains one of the most widely used configurations.
- Longer periods, such as 21 or 25: The RSI becomes smoother and less sensitive to short-term fluctuations. This may reduce noise but can also delay signals.
There is no universally perfect RSI setting. The appropriate configuration depends on the market, timeframe, strategy and trader’s objectives.
Why RSI Matters to Traders
Price tells traders what the market is doing. Momentum indicators can provide additional information about how strongly price has been moving.
This distinction can be useful because two markets may both be rising while exhibiting very different momentum characteristics. One may be experiencing strong, accelerating buying pressure, while another may be rising gradually with weakening momentum.
RSI can therefore be used to investigate several important questions:
- Is recent buying momentum unusually strong?
- Is recent selling pressure becoming extreme?
- Is momentum confirming the direction of price?
- Is momentum weakening while price continues in the same direction?
- Could the current market environment warrant closer examination for a continuation, correction or potential reversal?
Used this way, RSI becomes more than a simple 30/70 indicator. It becomes a framework for studying the relationship between price movement and momentum.
What We Will Examine Next
Understanding the basic mechanics of RSI is only the beginning. The real challenge is learning how to interpret the indicator without falling into the trap of treating every reading as a trading signal.
In the next sections, we will examine overbought and oversold conditions, RSI divergence, failure swings, RSI trend behavior, trend confirmation, and practical ways of combining RSI with other technical-analysis tools.
Understanding the Key RSI Levels
One of the reasons the Relative Strength Index is so popular is its straightforward scale. RSI moves between 0 and 100, allowing traders to quickly assess the intensity of recent price momentum.
However, experienced traders do not simply look at one RSI number and immediately place a trade. The location of the indicator, the direction in which it is moving, the underlying price trend and the surrounding market structure all matter.
RSI Above 70: The Overbought Zone
An RSI reading above 70 is traditionally described as overbought. This means recent upward price momentum has become particularly strong compared with the recent downward movements used in the calculation.
It is important to understand that overbought does not mean that the market is automatically too expensive or that a decline must follow. In a strong bullish trend, RSI can remain above 70 while price continues to make higher highs.
For this reason, traders should avoid using the 70 level as an automatic sell signal. Instead, an overbought reading can be treated as a signal to investigate the market more carefully.
For example, a trader might ask:
- Is price approaching a major resistance level?
- Is the broader trend still strongly bullish?
- Is RSI continuing to make higher highs along with price?
- Has RSI begun weakening while price continues rising?
- Is there a bearish reversal pattern or other confirmation?
These questions provide much more useful information than simply reacting to the number 70.
RSI Below 30: The Oversold Zone
An RSI reading below 30 is traditionally described as oversold. It indicates that recent downward momentum has become particularly strong relative to the selected calculation period.
Again, oversold does not necessarily mean that price must immediately recover. A market experiencing strong fundamental or technical selling pressure can remain below 30 while the downtrend continues.
Instead of interpreting an oversold reading as an automatic buy signal, traders can use it as a reason to examine whether selling momentum is beginning to weaken.
Useful questions include:
- Is price approaching an established support zone?
- Is the broader market trend bearish, bullish or ranging?
- Is RSI beginning to turn upward?
- Is price forming a bullish reversal pattern?
- Is bullish divergence developing?
The RSI 50 Level: The Often-Overlooked Momentum Reference
Although traders frequently focus on the 30 and 70 levels, the 50 level can also provide valuable information.
The midpoint can be used as a broad indication of whether recent momentum is leaning toward bullish or bearish conditions.
- RSI above 50: Momentum is generally showing a bullish bias.
- RSI below 50: Momentum is generally showing a bearish bias.
- RSI repeatedly crossing 50: The market may be experiencing weaker directional momentum or moving within a range.
The 50 level should not be treated as an absolute boundary between buyers and sellers. Rather, it can serve as an additional context tool.
For example, during an established uptrend, RSI may repeatedly find support around the 40–50 area before moving higher again. During a strong downtrend, RSI may struggle to move significantly above 50 before sellers regain control.
RSI in Trending Markets
One of the most important skills in mastering RSI is learning how the indicator behaves differently in trending and ranging markets.
Many beginners learn that RSI above 70 means “sell” and below 30 means “buy.” This approach may appear logical at first, but it can become particularly dangerous when the market enters a strong trend.
A powerful uptrend can keep RSI elevated for a considerable period. Similarly, a strong downtrend can keep RSI depressed for an extended period.
RSI During a Strong Uptrend
In a healthy bullish trend, RSI can spend significant amounts of time above 50. During particularly strong advances, it may repeatedly reach or exceed 70.
Instead of automatically looking for short positions whenever RSI becomes overbought, traders can watch how the indicator behaves during pullbacks.
If RSI falls from an elevated level but finds support around the 40–50 region and then turns higher as price resumes its advance, this may provide evidence that bullish momentum remains relatively strong.
This is one reason trend-following traders often use RSI differently from mean-reversion traders. Rather than trying to sell strength, they may use temporary momentum weakness to identify potential continuation opportunities.
RSI During a Strong Downtrend
The opposite can occur during a sustained bearish trend.
RSI may repeatedly remain below 50 and can reach oversold territory several times while price continues making lower highs and lower lows.
A trader who automatically buys every time RSI falls below 30 could therefore enter multiple positions against the prevailing trend.
Instead, traders can monitor whether RSI rallies toward the 40–50 area and then turns lower again while price remains structurally bearish.
RSI in Range-Bound Markets
RSI can behave differently when price is moving sideways between clearly defined support and resistance levels.
In a range-bound market, price repeatedly moves between an upper boundary and a lower boundary rather than establishing a sustained directional trend. Under these conditions, traditional RSI overbought and oversold readings may become more useful.
For example, if price approaches established resistance while RSI moves above 70, traders may begin watching for evidence that bullish momentum is weakening.
Likewise, if price approaches established support while RSI moves below 30, traders may monitor the market for signs that selling pressure is losing strength.
The critical point is that the RSI reading becomes more meaningful when it occurs at a significant area on the price chart.
Using RSI With Support and Resistance
Support and resistance can provide important context for interpreting momentum.
Consider two hypothetical situations.
- Situation A: RSI falls below 30 while price is sitting in the middle of an established trading range.
- Situation B: RSI falls below 30 while price simultaneously approaches a well-established support zone and begins showing signs of rejection.
The second situation may deserve greater attention because several pieces of information are pointing toward the same area. Nevertheless, confirmation is still necessary, and neither setup guarantees a successful trade.
This illustrates a broader principle of technical analysis: indicators are generally more useful when interpreted in context rather than in isolation.
Reading the Direction of RSI, Not Just Its Number
Another important aspect of RSI analysis is observing the direction of the indicator.
Two markets can both have an RSI reading of 60, yet the information may be quite different.
In one market, RSI may have risen from 40 to 60, indicating strengthening momentum. In another, RSI may have fallen from 75 to 60, indicating that momentum has weakened even though the current reading is identical.
This is why traders should consider both the level and trajectory of RSI.
- Rising RSI: Recent momentum is strengthening.
- Falling RSI: Recent momentum is weakening.
- RSI holding above 50: Can support a bullish momentum interpretation.
- RSI remaining below 50: Can support a bearish momentum interpretation.
The direction of RSI becomes particularly valuable when it is compared with what price is doing.
Why RSI Should Be Combined With Price Action
RSI is derived from price, which means it should not be viewed as an independent source of market information. Price remains the foundation of technical analysis.
A more complete analysis may therefore combine RSI with:
- Trend direction
- Support and resistance
- Market structure
- Candlestick behavior
- Moving averages
- Volume, where reliable volume data is available
- Other momentum or trend indicators
The objective is not to collect as many indicators as possible. Instead, the goal is to create a logical framework in which different forms of evidence can support or challenge a trading idea.
From RSI Extremes to Momentum Divergence
The 30 and 70 levels are only the beginning of RSI analysis. One of the most closely watched applications of the indicator is divergence—a situation where price and RSI appear to tell different stories about momentum.
Divergence can sometimes provide an early warning that the strength behind an existing price movement is changing.
In the next section, we will examine bullish and bearish RSI divergence, how to identify it correctly, why divergence can fail, and how traders can seek confirmation before acting on it.
RSI Divergence: When Price and Momentum Disagree
One of the most valuable ways to use the Relative Strength Index is to compare its movement with the movement of price. This technique is known as RSI divergence.
Divergence occurs when price and the RSI are no longer moving in the same direction. The underlying idea is straightforward: if price continues advancing or declining but the momentum behind that movement begins to weaken, the market may be approaching an important decision point.
However, divergence should be viewed as an early warning signal, rather than a guaranteed reversal signal. Markets can remain in a trend for much longer than expected, even after momentum divergence appears.
What Is Bearish RSI Divergence?
A classic bearish RSI divergence occurs when price forms a higher high while RSI forms a lower high.
In simple terms, price is still reaching new highs, but the momentum oscillator is failing to confirm the strength of those new highs.
This can suggest that buying momentum is weakening.
For example, imagine that a currency pair rises to a new swing high and RSI reaches 76. Price then makes another higher high, but RSI reaches only 68. The market has moved higher, but the momentum reading has failed to match the previous extreme.
That disagreement may deserve attention, particularly if it occurs near major resistance or after an extended bullish move.
What Is Bullish RSI Divergence?
A classic bullish RSI divergence occurs when price forms a lower low while RSI forms a higher low.
Here, price is continuing downward, but the momentum behind the decline is weakening.
For example, suppose an asset falls to a new swing low while RSI reaches 24. Price then makes another lower low, but RSI rises to 31 instead of making another lower low.
The market has moved lower, but downside momentum has failed to reach its previous intensity. This may indicate that selling pressure is losing strength.
As with bearish divergence, bullish divergence is not an automatic buy signal. The market can continue declining despite a divergence pattern.
How to Identify RSI Divergence Correctly
One of the biggest problems with divergence analysis is that traders can see divergence almost everywhere if they do not use clear swing points.
A more disciplined approach is to compare meaningful price highs or lows rather than random fluctuations.
When looking for divergence, consider the following:
- Identify significant swing points: Focus on meaningful highs and lows that are clearly visible on the chart.
- Compare price structure: Determine whether price has actually formed a higher high or lower low.
- Compare the RSI structure: Check whether the corresponding RSI peak or trough has moved in the opposite direction.
- Consider the broader trend: Divergence occurring after a long extended move may deserve more attention than a minor divergence inside market noise.
- Look for confirmation: Wait for price action or another technical development to support the interpretation.
Regular Divergence vs. Hidden Divergence
Traders sometimes distinguish between regular divergence and hidden divergence.
Regular Bullish Divergence
Regular bullish divergence occurs when price makes a lower low while RSI makes a higher low. It can indicate that bearish momentum is weakening and that a potential upward reversal or recovery deserves attention.
Regular Bearish Divergence
Regular bearish divergence occurs when price makes a higher high while RSI makes a lower high. It can indicate weakening bullish momentum and the possibility of a correction or reversal.
Hidden Bullish Divergence
Hidden bullish divergence is generally associated with trend continuation. Price forms a higher low while RSI forms a lower low.
Rather than suggesting that the existing trend is necessarily ending, this pattern may indicate that a temporary pullback is losing momentum while the broader bullish structure remains intact.
Hidden Bearish Divergence
Hidden bearish divergence occurs when price forms a lower high while RSI forms a higher high. This can suggest that a temporary bullish retracement is losing momentum within a broader bearish trend.
RSI Failure Swings
Another traditional RSI concept developed by J. Welles Wilder is the failure swing.
Failure swings focus primarily on the behavior of RSI itself rather than requiring a divergence between price and the indicator.
The concept can be useful because it attempts to identify situations where momentum reaches an extreme but then fails to regain or break that extreme on a subsequent move.
Bearish Failure Swing
A bearish failure swing can develop after RSI moves above 70.
A simplified sequence is:
- RSI rises above 70.
- RSI then falls below its recent peak.
- RSI attempts another upward move but fails to exceed the previous peak.
- RSI subsequently breaks the intervening low.
This sequence can suggest that bullish momentum is losing control.
The setup becomes more interesting when it occurs alongside important resistance or a weakening price structure.
Bullish Failure Swing
A bullish failure swing is the opposite pattern.
- RSI falls below 30.
- RSI then rebounds.
- RSI makes another decline but fails to reach the previous low.
- RSI subsequently breaks the intervening high.
This can suggest that bearish momentum is weakening and that buyers may be beginning to regain control.
Again, confirmation from price action can help reduce the risk of acting on an isolated indicator pattern.
RSI as a Momentum Confirmation Tool
RSI does not have to be used exclusively to identify reversals. It can also help traders assess whether momentum is supporting an existing trend.
For example, during an uptrend, traders may monitor whether RSI consistently remains above 50. If price continues producing higher highs and higher lows while RSI maintains a bullish momentum profile, the indicator may be supporting the broader trend.
Conversely, during a downtrend, RSI remaining below 50 can reinforce the idea that bearish momentum continues to dominate.
This approach shifts the trader’s attention away from simply asking whether the market is overbought or oversold and toward a more useful question:
When RSI Divergence Fails
Divergence is attractive because it can appear to identify a reversal before the reversal becomes obvious on the price chart. But this characteristic also creates a major risk: traders may enter too early.
A market can continue trending even after multiple divergence signals.
This is particularly common when:
- The market is experiencing exceptionally strong momentum.
- A major fundamental catalyst is driving price.
- The broader trend remains firmly established.
- Price has not broken an important support or resistance structure.
- Traders enter solely because divergence exists without waiting for confirmation.
For this reason, divergence should be treated as a warning that deserves investigation, not as proof that a reversal has already occurred.
Using Price Structure to Confirm RSI Signals
A practical way to improve RSI analysis is to require price structure to support the indicator.
For example, suppose bearish RSI divergence appears while price is approaching major resistance. Instead of immediately opening a short position, a trader could wait to see whether price produces a meaningful bearish reaction, such as a rejection from resistance or a break of a relevant swing low.
Similarly, if bullish divergence appears near major support, the trader could wait for evidence that buyers are actually returning to the market.
This approach can reduce the temptation to trade every divergence and encourages traders to distinguish between a potential warning and an actual market reversal.
The Bigger Lesson From RSI Divergence
The greatest value of divergence may not be that it predicts every reversal. Its real value is that it encourages traders to compare price performance with underlying momentum.
When price is rising but RSI is failing to confirm that strength, traders have a reason to become more cautious. When price is falling while RSI begins recovering, traders may want to monitor the market for evidence that selling pressure is weakening.
This makes divergence particularly useful as part of a broader analytical process.
In the next section, we will move from individual RSI signals to a more complete trading framework by examining how RSI can be combined with MACD, moving averages, support and resistance, and price action without creating an unnecessarily complicated chart.
Combining RSI With Other Technical Indicators
Although the Relative Strength Index can provide useful information on its own, its greatest practical value often comes from combining it with other forms of technical analysis. The objective is not to fill a chart with indicators, but to use complementary tools that answer different questions.
RSI primarily examines momentum. A moving average can help identify trend direction, while support and resistance can provide important information about where price is trading. The MACD can offer another perspective on momentum and trend changes.
When these tools are used together logically, traders can build a more structured decision-making process.
RSI and Moving Averages
Moving averages are commonly used to identify the broader direction of a market. When combined with RSI, they can help traders distinguish between potential trend-following opportunities and situations where an RSI extreme may be misleading.
For example, a trader might use a longer-term moving average, such as the 200-period moving average, to establish a broad directional bias.
- Price above the moving average: May indicate that the broader market environment is bullish.
- Price below the moving average: May indicate that the broader market environment is bearish.
- Price repeatedly crossing the moving average: May indicate a less decisive or range-bound environment.
RSI can then be used to study momentum within that broader context.
For instance, during a bullish environment, a temporary decline in RSI toward the 40–50 region may attract the attention of a trend-following trader who is looking for evidence that a pullback is losing momentum.
The same concept can be applied in reverse during a bearish market.
RSI and Support & Resistance
Support and resistance can add an important layer of context to RSI analysis.
A momentum reading becomes more meaningful when it occurs at a technically significant area on the price chart.
Consider an asset approaching a well-established resistance level while RSI is above 70. The overbought reading alone does not prove that price will reverse. However, if price begins rejecting resistance and RSI simultaneously shows weakening momentum, the combination may provide a stronger reason to monitor the market for a potential bearish setup.
The same principle applies to support.
If price reaches a significant support area while RSI enters oversold territory, traders can watch for evidence that selling pressure is weakening. A bullish price reaction combined with improving RSI momentum may provide additional confirmation.
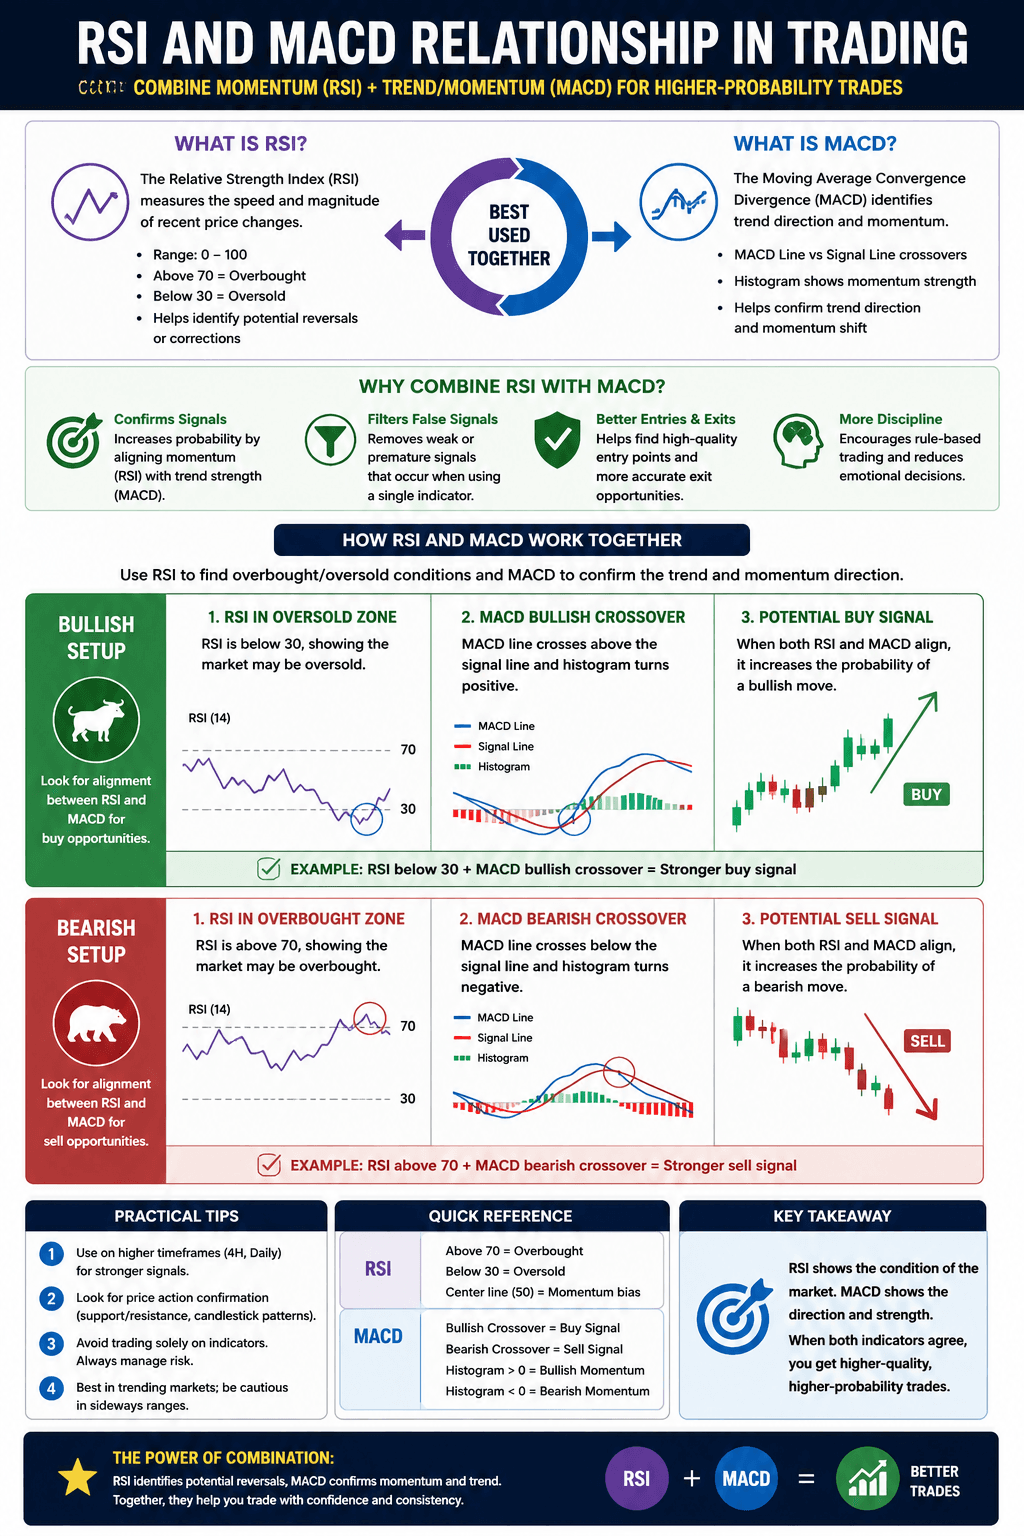
RSI and MACD: Combining Momentum Perspectives
The Moving Average Convergence Divergence (MACD) is another widely used technical indicator. It uses moving averages to help traders study momentum and changes in trend behavior.
RSI and MACD can complement each other because they approach momentum analysis differently.
For a deeper explanation of MACD, readers can also explore the SkyPress guide: The “Magic” Trading Indicator: Moving Average Convergence Divergence (MACD) .
RSI and Price Action
Perhaps the most important companion to RSI is price action itself.
Because RSI is calculated from price, traders should avoid allowing the indicator to override what the market is actually doing.
For example, if RSI becomes overbought while price continues forming a sequence of higher highs and higher lows, there may be little evidence of a bearish reversal at that moment.
Conversely, if RSI is overbought and price begins breaking important bullish structure, the combination may deserve greater attention.
The same principle applies to bearish markets. An oversold RSI reading is not particularly meaningful by itself if price continues producing lower highs and lower lows with strong downside momentum.
A Simple RSI Confirmation Framework
Rather than memorizing dozens of RSI patterns, traders can develop a simple framework for evaluating a potential setup.
Step 1: Identify the Market Environment
First determine whether the market is trending upward, trending downward or moving sideways. RSI behaves differently in each environment.
Step 2: Identify Important Price Levels
Mark significant support, resistance, previous swing highs, previous swing lows and other areas where price has demonstrated a meaningful reaction.
Step 3: Examine RSI Momentum
Look at the RSI level and direction. Ask whether momentum is strengthening, weakening or remaining relatively balanced.
Step 4: Look for Confirmation
If RSI suggests a potential reversal or continuation, look for supporting evidence from price action, market structure, moving averages or another complementary technical tool.
Step 5: Define the Risk Before Entering
Before placing a trade, determine where the idea would be considered invalid. This helps prevent the trader from moving a stop-loss simply because price moves against the position.
Step 6: Execute Without Overcomplicating the Setup
Once the conditions of the trading plan are satisfied, execution should remain disciplined. Adding more indicators after a setup has already been identified can create confusion rather than improve the decision.
A Hypothetical RSI Trading Example
Consider a hypothetical currency pair that has been trending upward for several weeks.
Price remains above a major moving average and continues producing higher highs and higher lows. During a temporary pullback, RSI falls from 68 toward 45.
A beginner might interpret the falling RSI as evidence that the bullish trend is ending. A more structured analysis would ask whether price structure has actually changed.
If price remains above important support and subsequently begins moving higher again while RSI turns upward from the mid-range, the RSI movement may simply represent a temporary cooling of momentum rather than a confirmed trend reversal.
This example illustrates an important lesson: momentum can weaken without the trend necessarily reversing.
Why Confirmation Matters
Technical indicators can produce conflicting information because markets are dynamic. RSI may suggest weakening momentum while price continues higher. MACD may turn bullish while a major resistance level remains directly overhead.
Instead of forcing these signals into a trade, disciplined traders can accept uncertainty and wait for the market to provide clearer evidence.
There will always be another market opportunity. Protecting capital and maintaining a consistent decision-making process is more important than participating in every price movement.
Keeping the RSI Strategy Simple
A common mistake is creating an extremely complicated indicator system in an attempt to eliminate uncertainty.
A chart containing RSI, MACD, several moving averages, multiple oscillators and numerous custom indicators may look sophisticated, but complexity does not necessarily improve decision-making.
A more practical framework may involve just a few clearly understood elements:
- Market trend or structure
- Important support and resistance levels
- RSI momentum
- One complementary confirmation tool
- A clearly defined risk-management plan
The objective is clarity. Traders should understand why each tool is on the chart and what specific question it is intended to answer.
From Indicators to a Complete Trading Process
RSI becomes considerably more useful when it is incorporated into a complete trading process rather than treated as a standalone signal generator.
The next stage is to translate these concepts into practical approaches that traders can test and adapt to their own markets and timeframes.
In the next section, we will examine practical RSI trading strategies, entry considerations, exits, multi-timeframe analysis, common mistakes and ways to avoid overtrading RSI signals.
Practical Ways to Use RSI in a Trading Strategy
Understanding what RSI measures is different from knowing how to incorporate it into an actual trading plan. The indicator can be applied in several ways, depending on whether a trader is looking for reversals, trend continuation or confirmation of an existing market structure.
There is no single RSI strategy that works in every market. Forex pairs, stocks, commodities and indices can behave differently, and market conditions can change over time. Therefore, traders should test any RSI-based approach before relying on it with real capital.
Strategy 1: RSI Pullbacks in an Established Trend
One practical approach is to use RSI to identify potential pullbacks within an established trend rather than attempting to predict major reversals.
Suppose a market is clearly bullish, with price producing higher highs and higher lows. Instead of selling simply because RSI reaches 70, a trader can wait for the market to pull back.
During the pullback, RSI may decline toward the 40–50 region. If price simultaneously approaches a previously identified support area and then begins showing signs of renewed buying pressure, the trader can investigate whether the broader bullish trend is resuming.
A simplified bullish framework could look like this:
- Identify an established bullish market structure.
- Wait for price to pull back rather than chasing an extended move.
- Monitor RSI as momentum temporarily weakens.
- Look for price to react around a meaningful support area.
- Wait for evidence that buyers are returning.
- Define the invalidation point before entering.
The important concept is that RSI is being used to understand the momentum of the pullback, rather than being used as an automatic buy signal.
Strategy 2: RSI Reversal Setups
Another approach is to look for potential reversals when RSI reaches an extreme and price begins showing evidence of exhaustion.
For example, a potential bearish reversal may receive attention when:
- Price reaches a significant resistance area.
- RSI enters or moves through the overbought zone.
- RSI begins weakening.
- A bearish divergence develops.
- Price produces a convincing bearish reaction or breaks relevant support.
The same logic can be applied to potential bullish reversals around major support.
This approach is more selective than simply buying below 30 or selling above 70 because it requires several pieces of evidence to align.
Strategy 3: RSI 50-Level Momentum Confirmation
The 50 level can also be incorporated into a trend-following framework.
A trader might monitor whether RSI remains above 50 during a bullish market or below 50 during a bearish market.
For example, if price breaks above resistance and RSI moves above 50 while continuing to strengthen, the indicator may provide additional evidence that bullish momentum is developing.
Likewise, if price breaks below support and RSI moves below 50 while continuing to weaken, bearish momentum may be receiving additional confirmation.
This approach can be useful because it does not require RSI to reach an extreme. Instead, it focuses on the broader momentum direction.
Strategy 4: RSI Divergence With Price Structure
Divergence can also be incorporated into a more structured reversal strategy.
A trader could begin by identifying a meaningful trend and then monitor RSI for signs that momentum is no longer confirming the price movement.
For a potential bearish setup:
- Price is in an extended bullish movement.
- Price forms a new significant high.
- RSI forms a lower high.
- Bearish divergence is identified.
- Price subsequently shows evidence of weakening.
- A defined entry and invalidation point are established.
For a potential bullish setup, the process can be reversed.
The major advantage of this framework is that divergence becomes part of a complete analysis rather than being treated as the entire reason for entering a trade.
Multi-Timeframe RSI Analysis
Another way traders can improve their understanding of RSI is by examining more than one timeframe.
A higher timeframe can provide information about the broader market environment, while a lower timeframe can help examine shorter-term price movements.
For example, a forex trader might examine:
- Daily chart: To understand the broader trend and market structure.
- 4-hour chart: To study intermediate momentum and pullbacks.
- 1-hour chart: To investigate a potential entry area.
The exact combination of timeframes will depend on the trader’s strategy and holding period.
The key principle is to avoid allowing a lower timeframe signal to completely contradict the broader market context without understanding why that conflict exists.
Example of Multi-Timeframe RSI Confirmation
Imagine that the daily chart shows a strong bullish trend. RSI remains above 50, while price continues to respect major support.
On the four-hour chart, however, RSI falls toward 40 as price pulls back.
Rather than immediately interpreting the lower RSI as bearish, the trader can recognize that the four-hour movement may simply represent a correction within the larger bullish trend.
If price reaches support and the four-hour RSI begins recovering, the trader now has a potentially more coherent picture: the higher timeframe remains bullish while the lower timeframe is showing signs of renewed momentum.
This does not guarantee a profitable trade, but it provides a more structured way to interpret conflicting signals.
RSI for Different Trading Styles
The way RSI is interpreted should also reflect the trader’s time horizon.
Day Traders
Day traders may use shorter timeframes and more responsive RSI settings. This can help them monitor short-term momentum, but it also increases the amount of market noise.
Because intraday markets can produce frequent false signals, day traders should be particularly careful about reacting to every movement above 70 or below 30.
Swing Traders
Swing traders typically hold positions for several days or weeks and may focus on four-hour or daily charts.
For these traders, RSI divergence, support and resistance, trend structure and momentum shifts may be particularly useful.
Position and Long-Term Traders
Longer-term traders may use RSI primarily as a supplementary tool rather than as a frequent entry indicator.
A weekly RSI reading, for example, can provide a broader perspective on momentum conditions while the trader focuses primarily on fundamental developments and longer-term price structure.
Choosing an RSI Setting
The standard 14-period setting is a useful starting point for many traders, but it should not be assumed to be optimal for every strategy.
Shorter settings can make RSI more responsive, while longer settings can make it smoother.
The temptation is to search for a “perfect” RSI setting that produces highly accurate entries. In practice, markets are too dynamic for a single setting to eliminate uncertainty.
Instead, traders should focus on understanding how their chosen RSI setting behaves under different market conditions and then evaluate it through historical testing and disciplined forward observation.
Backtesting an RSI Strategy
Before using an RSI strategy with real money, traders can test the rules against historical market data.
A useful backtest should have clearly defined rules. For example:
- What market will be traded?
- What timeframe will be used?
- What RSI setting will be applied?
- What conditions must exist before entering?
- What confirms the RSI signal?
- Where is the trade invalidated?
- How is the exit determined?
- How will losing and winning trades be recorded?
The objective is not to prove that an RSI strategy will always make money. Instead, testing helps traders understand how the rules have behaved historically and whether the strategy has characteristics that fit their objectives and risk tolerance.
Avoiding Overtrading RSI Signals
One of the biggest dangers of using oscillators is the temptation to trade too frequently.
RSI can cross above and below important levels many times during a volatile session. If every crossing becomes a trade, transaction costs, spread, slippage and repeated losses can quickly undermine performance.
A disciplined trader may therefore establish a hierarchy of importance:
- Overall market structure
- Important price levels
- RSI momentum condition
- Confirmation
- Risk and trade invalidation
If the broader conditions do not support the setup, there may be no reason to act simply because RSI has reached an extreme.
RSI Is a Tool, Not a Complete Trading System
Perhaps the most important lesson is that RSI alone cannot provide everything a trader needs to make a sound decision.
It does not tell traders why a currency pair is moving, whether an unexpected economic announcement is about to occur, whether liquidity conditions have changed, or whether a fundamental development has fundamentally altered market expectations.
Technical analysis therefore works best when traders understand what their indicators can and cannot tell them.
RSI can help answer questions about momentum. It cannot eliminate uncertainty.
Preparing for the Most Common RSI Mistakes
Even traders who understand the technical mechanics of RSI can misuse it in practice. Many problems come not from the indicator itself, but from unrealistic expectations about what it should accomplish.
In the next section, we will examine the most common RSI mistakes traders make, the limitations of momentum indicators, and the risk-management principles that should accompany any RSI-based strategy.
Common RSI Trading Mistakes
The Relative Strength Index is relatively easy to understand, but using it effectively requires more than memorizing the 30 and 70 levels. Many disappointing trading results come from misinterpreting what the indicator actually represents.
Understanding these mistakes can help traders use RSI more objectively and avoid turning a useful analytical tool into a source of impulsive decisions.
Mistake 1: Selling Every Time RSI Goes Above 70
This is perhaps the most common RSI mistake.
An RSI reading above 70 indicates strong recent upward momentum. It does not guarantee that price will reverse.
During a powerful bullish trend, RSI can remain above 70 while price continues to rise. A trader who repeatedly shorts the market simply because RSI is overbought may find themselves fighting the dominant trend.
A better approach is to examine the broader trend, price structure and evidence of momentum deterioration before considering a reversal.
Mistake 2: Buying Every Time RSI Falls Below 30
The opposite mistake occurs when traders treat every oversold reading as a guaranteed buying opportunity.
A strong bearish market can remain oversold for an extended period. If the fundamental or technical forces driving the decline remain intact, price may continue falling despite an RSI reading below 30.
Rather than automatically buying, traders can monitor whether selling pressure is actually weakening and whether price is beginning to respond around an important support area.
Mistake 3: Ignoring the Broader Trend
RSI signals become much harder to interpret when the broader market structure is ignored.
A bullish divergence during a powerful downtrend does not automatically mean that a major bottom has formed. Likewise, bearish divergence during a strong uptrend does not guarantee that a major top is in place.
Trend context helps traders determine whether an RSI signal is potentially indicating a reversal or merely a temporary pause in the existing trend.
Mistake 4: Treating Divergence as an Immediate Entry Signal
Divergence can provide an early warning that momentum is weakening, but it can remain unresolved for a considerable period.
Price may continue trending after divergence appears. Entering immediately can therefore expose traders to premature positions.
A more disciplined approach is to use divergence as a reason to become attentive and then wait for additional confirmation from price action or market structure.
Mistake 5: Changing RSI Settings Until the Historical Results Look Perfect
Another problem is excessive optimization.
A trader may test different RSI periods until one produces impressive historical results. However, a setting that performs exceptionally well on past data may not necessarily perform similarly in future market conditions.
This is sometimes referred to as overfitting.
Rather than searching endlessly for a perfect configuration, traders should choose a logical setting, understand its behavior and test the complete strategy across different market conditions.
Mistake 6: Using Too Many Indicators
Adding indicators does not automatically improve analysis.
If a chart contains RSI, MACD, Stochastic, multiple moving averages and several other oscillators, the trader may receive numerous signals that are difficult to reconcile.
Many indicators also derive their information from the same underlying price data. Consequently, several indicators appearing to agree may not necessarily represent several independent confirmations.
A cleaner approach is to use a small number of tools with clearly defined purposes.
Mistake 7: Ignoring Fundamental Events
Technical indicators operate on price data, but markets can be strongly affected by economic and fundamental developments.
Interest-rate decisions, inflation reports, employment data, central-bank communication, geopolitical developments and unexpected corporate announcements can cause rapid price movements.
An RSI signal that appears technically attractive can therefore fail when a major fundamental catalyst changes market expectations.
Technical analysis should not be treated as a substitute for understanding the broader environment in which a market operates.
Risk Management When Trading With RSI
A good technical setup does not guarantee a profitable trade. This is why risk management remains essential regardless of the indicator being used.
RSI can help traders identify potential opportunities, but it cannot control what happens after a position is opened.
Define the Trade Invalidation Point
Before entering a trade, traders should identify the price level or market condition that would invalidate the original idea.
For example, if a trader expects a bullish reaction from a particular support zone, a decisive break below that structure may indicate that the original thesis is no longer valid.
This is more logical than deciding where to place a stop-loss only after entering the position.
Use Position Sizing Carefully
Position size should be determined according to the amount of risk the trader is willing and able to accept, rather than simply choosing the largest position permitted by a broker.
A smaller position can help reduce the financial impact of an unsuccessful trade and may make it easier for the trader to follow the strategy without making emotional decisions.
Do Not Move Stop-Losses to Avoid Taking a Loss
One of the most damaging behaviors in trading is moving a stop-loss farther away simply because price is moving against the position.
If the original setup has been invalidated, extending the trade without a new analytical reason can turn a manageable loss into a much larger one.
Consider Risk-to-Reward Before Entering
Traders can also evaluate whether the potential reward justifies the amount of risk being taken.
For example, a setup with a clearly defined invalidation level but very limited upside potential may not be attractive even if RSI appears favorable.
The quality of a trade is therefore determined by more than the probability of being correct. The relationship between potential gain, potential loss and the overall trading plan also matters.
Limitations of the Relative Strength Index
Like every technical indicator, RSI has limitations. Understanding these limitations is essential if traders want to use the tool responsibly.
RSI Is Based on Historical Price Data
RSI is calculated from previous price movements. It does not have access to future information and cannot know what the next market event will be.
This means RSI should be regarded as a measurement of historical momentum rather than a prediction machine.
RSI Can Produce False Signals
Markets do not always respond to technical patterns in predictable ways. RSI can enter overbought or oversold territory and remain there longer than expected.
Divergence can also fail, while apparent momentum shifts can reverse again shortly afterward.
RSI Can Behave Differently in Different Market Conditions
An RSI strategy that performs reasonably well in a sideways market may behave poorly during a strong trend.
Likewise, a trend-following interpretation of RSI may be less useful when the market becomes highly range-bound.
This is why traders should understand the market environment before applying a particular RSI strategy.
RSI Does Not Explain Why Price Is Moving
RSI measures momentum but does not explain the underlying reason for that momentum.
A currency pair may be rising because of changing interest-rate expectations, economic data, central-bank policy or shifts in global risk sentiment. RSI can reflect the resulting price movement, but it does not independently explain the cause.
Can RSI Be Used Alone?
Technically, traders can build strategies around RSI alone. However, relying exclusively on one indicator can leave important information out of the analysis.
A more comprehensive approach is to combine RSI with price structure and a clearly defined trading plan.
For example, a trader might use:
- Price structure to identify the market trend.
- Support and resistance to locate important price areas.
- RSI to evaluate momentum.
- MACD or a moving average for additional confirmation.
- Risk management to control potential losses.
This creates a process in which each component has a specific purpose rather than simply generating more signals.
The Psychology Behind RSI
Although RSI is mathematical, its readings ultimately reflect the behavior of market participants.
Strong buying can push price upward rapidly, increasing RSI. Heavy selling can produce the opposite effect.
This means RSI can indirectly provide a visual representation of changing market enthusiasm, fear and momentum.
But traders must be careful not to confuse extreme momentum with an inevitable reversal. Markets can remain irrational or excessively bullish or bearish for longer than expected.
The discipline required to use RSI effectively therefore goes beyond technical knowledge. Traders must also resist the psychological temptation to predict tops and bottoms simply because the indicator has reached an extreme.
Building a Disciplined RSI Trading Routine
A repeatable routine can help prevent emotional decisions.
Before considering an RSI-based trade, traders can work through a simple checklist:
- What is the broader trend?
- Where are the important support and resistance levels?
- What is RSI currently showing?
- Is RSI strengthening, weakening or diverging from price?
- Is there confirmation from price action or another complementary tool?
- Where would the trade idea become invalid?
- Is the potential reward reasonable relative to the risk?
- Am I following my trading plan rather than reacting emotionally?
This type of process can help transform RSI from a simple indicator on a chart into part of a broader analytical framework.
What RSI Can—and Cannot—Do
The Relative Strength Index can be extremely useful when its role is understood correctly.
It can help traders evaluate momentum, identify potentially extreme conditions, compare momentum with price structure and monitor possible changes in market strength.
What it cannot do is guarantee the direction of the next price movement, eliminate losing trades or replace proper risk management.
That distinction is fundamental to using RSI responsibly.
SkyPress Opinion: RSI Works Best as a Context Tool
SkyPress Opinion
At SkyPress, we believe the biggest mistake traders make with the Relative Strength Index is treating it like a magic signal generator. RSI reaching 70 does not mean a trader should automatically sell, and RSI falling below 30 does not mean a trader should automatically buy.
The real value of RSI comes from understanding what momentum is doing in relation to price.
A strong bullish market can remain overbought while price continues rising. Likewise, a powerful bearish market can remain oversold while price continues falling. Fighting those trends simply because an oscillator has reached an extreme can expose traders to unnecessary losses.
We therefore view RSI primarily as a context and confirmation tool. Its readings become more meaningful when considered alongside market structure, support and resistance, price action and the broader trend.
Divergence is another particularly valuable concept. When price continues making new highs or lows while RSI fails to confirm the move, traders have a reason to pay closer attention to momentum. But divergence should create awareness—not blind confidence.
At the same time, traders should resist the temptation to build increasingly complicated strategies by adding indicator after indicator. More information is not always better information. A simple framework that a trader understands and can execute consistently is often more useful than a highly complicated chart.
Perhaps the most important lesson is that RSI cannot replace discipline. A trader can identify an excellent-looking momentum setup and still experience a loss. That is a normal part of financial markets.
Successful trading therefore requires more than finding the right indicator. It requires patience, risk control, consistency, realistic expectations and the ability to accept that no technical tool can predict the future with certainty.
Key Takeaways: Mastering Market Momentum With RSI
After studying the Relative Strength Index in detail, several important principles stand out.
- RSI measures momentum: It evaluates the speed and magnitude of recent price movements rather than directly predicting future prices.
- The 30 and 70 levels are reference points: They can identify traditionally oversold and overbought conditions, but neither level guarantees a reversal.
- RSI above 50 can indicate bullish momentum: While RSI below 50 can indicate a bearish momentum bias. These are contextual observations rather than absolute rules.
- Strong trends can remain overbought or oversold: Traders should avoid automatically trading against a strong trend simply because RSI reaches an extreme.
- Divergence can reveal weakening momentum: Bullish and bearish divergence can provide an early warning that price and momentum are no longer moving together.
- Divergence requires confirmation: A divergence signal alone does not guarantee that a reversal will occur.
- Price action remains essential: RSI should be interpreted alongside market structure, support, resistance and trend direction.
- RSI can complement MACD and moving averages: Using tools with different analytical purposes can provide additional context without unnecessarily complicating a trading strategy.
- Different market conditions require different interpretations: RSI behaves differently in strong trends, ranges and highly volatile environments.
- Risk management remains essential: No RSI strategy can eliminate losses. Position sizing, trade invalidation and disciplined execution remain fundamental.
- There is no perfect RSI setting: The standard 14-period setting is a useful starting point, while shorter or longer settings change the indicator’s sensitivity.
- Testing matters: Traders should evaluate an RSI strategy through historical testing and disciplined observation before committing significant capital.
Frequently Asked Questions About RSI
1. What is the Relative Strength Index (RSI)?
The Relative Strength Index is a momentum oscillator developed by J. Welles Wilder Jr. It moves between 0 and 100 and compares the magnitude of recent gains with recent losses to help traders evaluate momentum conditions.
2. What does RSI above 70 mean?
An RSI reading above 70 is traditionally considered overbought. It indicates strong recent upward momentum relative to the selected calculation period. However, it does not guarantee that price will fall.
3. What does RSI below 30 mean?
An RSI reading below 30 is traditionally considered oversold. It indicates strong recent downward momentum. It does not guarantee that price will immediately recover.
4. Is RSI 70 a sell signal?
Not by itself. RSI above 70 can occur during powerful bullish trends that continue for extended periods. Traders should consider the broader trend, price structure, resistance and confirmation before treating an overbought reading as a potential reversal setup.
5. Is RSI 30 a buy signal?
Not automatically. A market can remain oversold during a strong bearish trend. Traders should look for additional evidence that selling pressure is weakening before considering a bullish setup.
6. What is the best RSI setting?
There is no universally best setting. The traditional RSI uses 14 periods, while shorter settings make the indicator more responsive and longer settings make it smoother. The most appropriate setting depends on the market, timeframe and trading strategy.
7. What is RSI divergence?
RSI divergence occurs when price and RSI move in different directions. For example, bearish divergence occurs when price makes a higher high while RSI makes a lower high. Bullish divergence occurs when price makes a lower low while RSI makes a higher low.
8. Is RSI divergence reliable?
Divergence can be useful for identifying potential momentum changes, but it is not guaranteed to produce a reversal. Strong trends can continue despite divergence, so traders should seek confirmation from price structure and other relevant market information.
9. Can RSI be used for forex trading?
Yes. RSI is widely used in forex technical analysis and can be applied to different currency pairs and timeframes. However, forex traders should also consider factors such as economic data, interest-rate expectations, central-bank decisions and market volatility.
10. Can RSI be used for stocks and commodities?
Yes. RSI can be applied to stocks, commodities, indices and many other liquid financial markets. The interpretation should still account for the characteristics and market conditions of the specific asset.
11. Should RSI be used alone?
RSI can form part of a standalone strategy, but many traders prefer to combine it with price action, market structure, support and resistance or another complementary tool. The objective should be better context rather than simply adding more indicators.
12. What is the RSI 50 level?
The 50 level represents the midpoint of the RSI range. RSI above 50 is often interpreted as evidence of relatively stronger bullish momentum, while RSI below 50 can indicate relatively stronger bearish momentum.
13. Can RSI predict market reversals?
No indicator can reliably predict every market reversal. RSI can highlight momentum conditions and potential weakening, but future price movements remain uncertain.
14. How can beginners start using RSI?
Beginners can start with the traditional 14-period setting and learn how RSI behaves in different market conditions. Rather than immediately trading every overbought or oversold reading, beginners should practice identifying trends, support and resistance, momentum shifts and confirmation.
15. Is RSI suitable for short-term trading?
RSI can be used on short-term charts, but shorter timeframes often contain more market noise and false signals. Traders should therefore have clearly defined rules and understand how volatility affects their strategy.
16. Can RSI replace risk management?
Absolutely not. RSI is an analytical indicator, not a risk-management system. Traders still need to determine appropriate position sizes, potential loss limits and trade invalidation levels before entering positions.
Final Thoughts: Turning RSI Knowledge Into Better Market Analysis
The Relative Strength Index has remained one of the most popular momentum indicators because it is simple enough to understand while offering considerable depth for traders who learn how to interpret it properly.
Its greatest strength is not the familiar 30 and 70 levels. Instead, RSI can help traders study the relationship between price movement and momentum.
When RSI is combined with trend analysis, market structure, support and resistance, divergence and disciplined risk management, it can become a valuable component of a broader technical-analysis framework.
But traders should never forget what RSI cannot do. It cannot see the future, eliminate uncertainty or guarantee profitable trades.
The goal of mastering RSI is therefore not to find a magical number that tells you exactly when to buy or sell. The goal is to develop the ability to interpret momentum objectively, recognize when market conditions are changing and make decisions according to a clearly defined trading plan.
Whether you trade forex, stocks, commodities or indices, that principle remains the same: use RSI to understand the market—not to blindly predict it.
SkyPress Disclaimer
The information provided in this article is intended for educational and informational purposes only. It is not financial, investment, trading, legal or tax advice, and it should not be interpreted as a recommendation to buy, sell or hold any financial instrument.
The Relative Strength Index (RSI), MACD, moving averages, price-action techniques and other technical-analysis tools discussed in this article are analytical tools that use historical or current market data. They cannot predict future market movements with certainty and should not be regarded as guaranteed methods of generating profits.
Financial markets, including forex, stocks, commodities, indices and other instruments, involve significant risk. The possibility exists of losing some or all of the capital committed to a trade or investment. Leverage can substantially increase both potential gains and potential losses.
Readers should conduct their own research and consider their individual financial circumstances, objectives, experience and risk tolerance before making any financial decision. Where appropriate, readers should seek advice from a qualified and appropriately licensed financial professional.
Past market performance, historical examples or hypothetical scenarios discussed in this article do not guarantee future results. Any examples used by SkyPress are intended solely to explain concepts and should not be interpreted as predictions of future market performance.
SkyPress does not guarantee the accuracy, completeness or timeliness of market information referenced in educational content and accepts no responsibility for losses or damages arising from decisions made solely on the basis of information presented in this article.
Trade and invest responsibly. Never risk money you cannot afford to lose.
Master Momentum. Respect Risk. Stay Disciplined.
RSI can help you understand market momentum, but disciplined analysis and responsible risk management remain at the heart of informed trading.