
MACD Indicator Explained: How to Use the Moving Average Convergence Divergence in Trading

The “Magic” Trading Indicator: Moving Average Convergence Divergence (MACD)
The Moving Average Convergence Divergence (MACD) is one of the most widely recognized momentum and trend-following indicators used in technical analysis. Despite sometimes being described as a “magic” indicator, MACD is not a tool that can predict the future or guarantee profitable trades. Its real value comes from helping traders understand changes in momentum, identify potential trend shifts, and confirm the strength of an existing market move.
If you are new to currency trading, our Beginner Forex Traders Guide provides a broader introduction to forex markets, technical analysis, trading concepts, and the fundamentals traders should understand before applying indicators.
The indicator can be applied across a wide range of financial markets, including forex, stocks, indices, commodities, and cryptocurrencies. It is particularly popular because it combines several useful pieces of information into one indicator: the relationship between moving averages, momentum, trend direction, crossovers, and divergence.
For beginners, however, the MACD can initially appear complicated. Traders may see two lines, a histogram, and a zero line without immediately understanding what each element means or how they work together. Once its underlying calculation and interpretation are understood, the MACD becomes considerably easier to use.
This comprehensive SkyPress guide explains how MACD works, how to interpret its components, how traders use crossovers and divergence, how it can be incorporated into trend-following strategies, and the limitations that should be considered before using it in real-market decisions.
What Is the MACD Indicator?

MACD stands for Moving Average Convergence Divergence. It was developed by technical analyst Gerald Appel and became popular because of its ability to combine trend and momentum analysis into a relatively simple visual indicator.
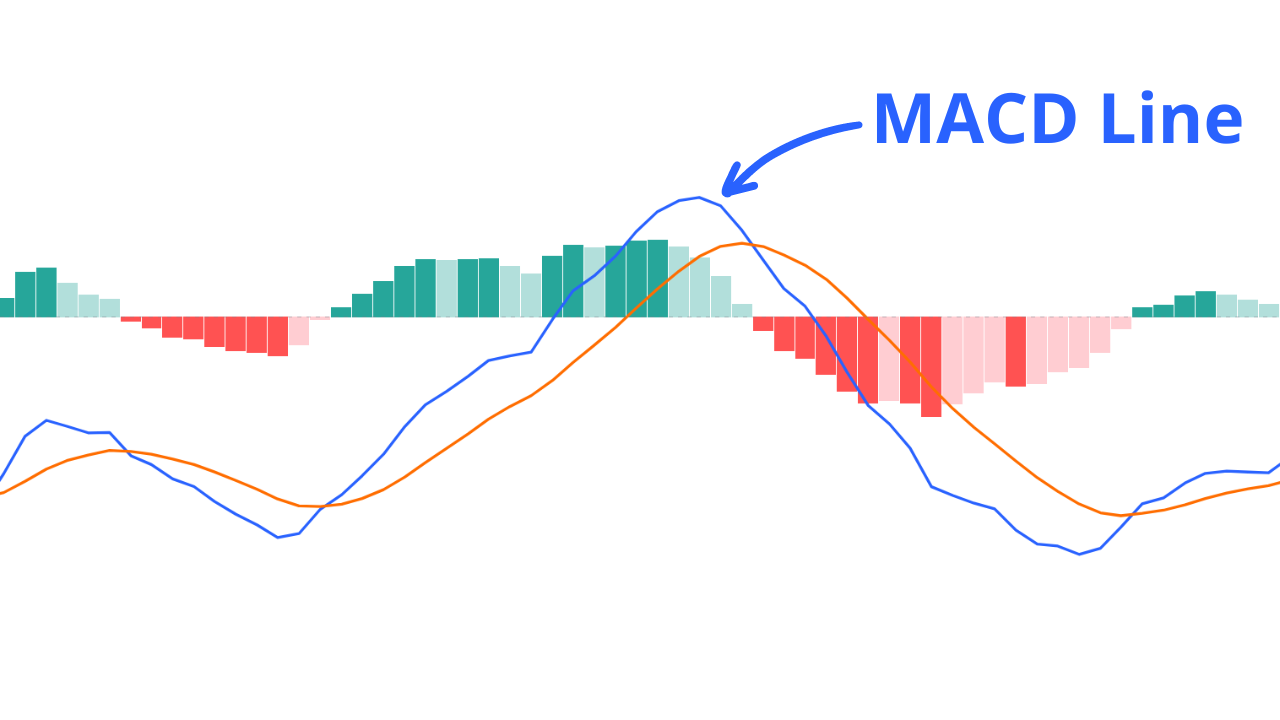
At its core, MACD measures the relationship between two Exponential Moving Averages (EMAs) of price. The standard MACD calculation uses a 12-period EMA and a 26-period EMA. The difference between these two averages produces the MACD line.
A third line, known as the Signal Line, is then calculated as a 9-period EMA of the MACD line. The relationship between the MACD line and Signal Line is used to identify potential changes in momentum.
The indicator also includes a histogram, which visually represents the difference between the MACD line and the Signal Line. This allows traders to see not only whether momentum is bullish or bearish, but also how that momentum may be changing.
The standard MACD settings are therefore:
- Fast EMA: 12 periods
- Slow EMA: 26 periods
- Signal Line: 9-period EMA of the MACD line
These settings are widely used because they provide a balance between responsiveness and noise. However, traders can adjust the settings depending on their strategy, market, and timeframe.
Why Is MACD Considered a Powerful Indicator?
One reason MACD remains popular is that it provides several forms of information at the same time. Instead of looking only at price direction, traders can use MACD to examine the relationship between short-term and longer-term momentum.
When the faster EMA moves further above the slower EMA, the MACD generally rises. This can indicate increasing bullish momentum. Conversely, when the faster EMA moves below the slower EMA, the MACD generally declines, suggesting increasing bearish momentum.
This makes MACD particularly useful when a market is developing a recognizable trend.

For example, during a strong uptrend, the MACD may remain above its Signal Line and frequently stay above the zero line. During a sustained downtrend, the opposite may occur, with MACD remaining below its Signal Line and often below zero.
However, this does not mean that every crossover represents a profitable trading opportunity. Market conditions matter greatly, and MACD can produce false or late signals, particularly when prices are moving sideways.
Understanding the Three Main Components of MACD
To use MACD effectively, traders should first understand the three major components displayed on most trading platforms: the MACD Line, the Signal Line, and the Histogram.
1. The MACD Line
The MACD Line is calculated by subtracting the 26-period EMA from the 12-period EMA:
Because the calculation compares two exponential moving averages, the MACD Line responds to changes in price momentum.
When the 12-period EMA is above the 26-period EMA, the MACD value is generally positive. When the 12-period EMA is below the 26-period EMA, the MACD value is generally negative.
The further the two moving averages separate, the larger the difference between them can become. This can provide traders with information about the strength of the underlying momentum.
2. The Signal Line
The Signal Line is typically a 9-period EMA of the MACD Line. It moves more slowly than the MACD Line and acts as a reference point for identifying momentum changes.
When the MACD Line crosses above the Signal Line, traders may interpret this as a potential bullish momentum signal. When the MACD Line crosses below the Signal Line, it may indicate increasing bearish momentum.
The important word here is potential. A crossover does not automatically mean that a trader should enter a position. Price structure, trend direction, support and resistance, volatility, and the broader market environment should also be considered.
3. The MACD Histogram
The histogram represents the difference between the MACD Line and the Signal Line:
The histogram is displayed as vertical bars that move above or below the zero level. Its size can provide a visual indication of the distance between the MACD Line and Signal Line.
When histogram bars expand above zero, bullish momentum may be strengthening. When bars contract toward zero, bullish momentum may be losing strength.
Similarly, expanding negative histogram bars can indicate strengthening bearish momentum, while shrinking negative bars can suggest that bearish momentum is weakening.
This makes the histogram particularly useful for observing changes in momentum rather than simply identifying whether the market is bullish or bearish.
What Does the MACD Zero Line Tell Traders?
The zero line is another important part of MACD analysis. It provides a reference point that helps traders assess the relationship between the fast and slow EMAs.
When MACD is above zero, the 12-period EMA is generally above the 26-period EMA. This often reflects a bullish market environment or positive momentum.
When MACD is below zero, the 12-period EMA is generally below the 26-period EMA. This can indicate a bearish environment or negative momentum.
A move through the zero line can therefore provide additional trend information.
- MACD moving above zero: May indicate improving bullish momentum or a developing upward trend.
- MACD moving below zero: May indicate increasing bearish momentum or a developing downward trend.
- MACD remaining above zero: Can support the view that bullish conditions remain dominant.
- MACD remaining below zero: Can support the view that bearish conditions remain dominant.
The zero line should not be interpreted in isolation. A trader should compare it with price action and the broader market structure before drawing conclusions.
How MACD Measures Momentum
Momentum describes the strength and speed of a price movement. MACD helps traders monitor momentum by comparing the behavior of two EMAs with different speeds.
Suppose an asset begins rising rapidly. The faster 12-period EMA will normally respond more quickly to the price increase than the slower 26-period EMA. The gap between the two averages can therefore increase, causing the MACD Line to rise.
If the price continues moving upward but begins doing so more slowly, the gap between the EMAs may begin to narrow. The MACD may remain positive, but its momentum can start weakening.
This distinction is important:
A weakening MACD does not necessarily mean that price is immediately going to reverse.
It may simply mean that the strength of the current move is declining. Price can continue rising even while bullish momentum weakens. This is one of the reasons MACD should be interpreted in context rather than used as an automatic reversal signal.
MACD and Market Trends
MACD generally performs more naturally in trending markets because its calculations are based on moving averages. Moving averages are designed to follow price trends, meaning MACD can provide useful confirmation when the market is making sustained directional moves.
In an established uptrend, traders may look for MACD to remain above zero and for bullish crossovers to occur during temporary pullbacks.
In an established downtrend, traders may look for MACD to remain below zero and for bearish crossovers to occur as price rebounds before continuing lower.
This approach can help traders avoid taking every crossover as an independent signal.
Instead, the trader asks a more important question:
That simple question can help reduce the number of low-quality signals generated when the market is moving sideways or experiencing short-term volatility.
MACD Crossover Signals
One of the most common ways traders use the MACD is by watching for crossovers between the MACD Line and the Signal Line. These crossovers can indicate that momentum may be changing direction.
However, a crossover should not automatically be interpreted as a command to buy or sell. The quality of a MACD crossover depends heavily on the market’s trend, price structure, timeframe, and surrounding conditions.
Bullish MACD Crossover
A bullish MACD crossover occurs when the MACD Line moves above the Signal Line. This suggests that short-term momentum is becoming stronger relative to the recent momentum represented by the Signal Line.
Traders may interpret this as an indication that buying pressure is increasing or that a bullish price move could be developing.
A bullish crossover can be considered more meaningful when:
- Price is already showing a broader bullish structure.
- The crossover occurs after a pullback within an established uptrend.
- The MACD moves above the zero line or is already above it.
- The histogram begins expanding above zero.
- Price breaks an important resistance level at the same time.
- Other technical evidence supports the bullish scenario.
For example, if an asset is making higher highs and higher lows and then experiences a temporary pullback, a bullish MACD crossover as the price begins recovering may provide additional confirmation that upward momentum is returning.
Bearish MACD Crossover
A bearish MACD crossover occurs when the MACD Line falls below the Signal Line. This indicates that short-term momentum is weakening relative to the Signal Line and may suggest increasing selling pressure.
A bearish crossover can carry greater significance when:
- Price is already forming a broader bearish structure.
- The crossover occurs after an upward retracement in a downtrend.
- The MACD is below the zero line.
- The histogram expands further below zero.
- Price breaks an important support level.
- Other technical factors confirm bearish conditions.
For instance, if an asset is consistently making lower highs and lower lows, a bearish MACD crossover following a temporary upward correction may provide confirmation that bearish momentum is returning.
Why the Location of a Crossover Matters
Not all MACD crossovers have the same significance. One of the most important considerations is where the crossover occurs relative to the zero line and the overall price trend.
A bullish crossover occurring well below the zero line may represent the early stages of a momentum recovery, but it does not necessarily mean that a major uptrend has begun.
Likewise, a bearish crossover occurring far above the zero line may indicate weakening bullish momentum without necessarily confirming a full bearish reversal.
This is why experienced traders often combine three pieces of information:
- The direction of the crossover.
- The position of MACD relative to the zero line.
- The underlying price structure and trend.
Considering these factors together can provide a more complete picture than relying on the crossover alone.
Reading the MACD Histogram
The MACD histogram can provide valuable information about the changing relationship between the MACD Line and Signal Line. Rather than focusing only on whether the bars are positive or negative, traders can also observe whether the bars are expanding or contracting.
Expanding Positive Histogram
When the histogram is above zero and the bars become progressively larger, it may indicate that bullish momentum is increasing.
This can occur when the MACD Line moves further above the Signal Line. In a trending market, expanding positive bars can support the view that the upward move is gaining strength.
Contracting Positive Histogram
When positive histogram bars begin becoming smaller, bullish momentum may be weakening.
This does not necessarily mean that price must immediately fall. The market may continue moving higher while the rate of upward momentum slows.
For this reason, contracting histogram bars can be viewed as an early warning of momentum deterioration rather than a guaranteed reversal signal.
Expanding Negative Histogram
When the histogram is below zero and the negative bars become increasingly large, bearish momentum may be strengthening.
This can provide confirmation that sellers are gaining control, particularly when price is simultaneously breaking support or continuing to form lower highs and lower lows.
Contracting Negative Histogram
When negative histogram bars begin shrinking toward the zero line, bearish momentum may be weakening.
Again, weakening bearish momentum does not automatically mean that a bullish reversal is underway. It simply indicates that the difference between the MACD Line and Signal Line is becoming smaller.
| MACD Condition | Possible Interpretation |
|---|---|
| MACD above zero | Bullish momentum may be dominant |
| MACD below zero | Bearish momentum may be dominant |
| MACD crosses above Signal Line | Potential bullish momentum shift |
| MACD crosses below Signal Line | Potential bearish momentum shift |
| Positive bars expanding | Bullish momentum may be strengthening |
| Positive bars contracting | Bullish momentum may be weakening |
| Negative bars expanding | Bearish momentum may be strengthening |
| Negative bars contracting | Bearish momentum may be weakening |
MACD Divergence: Looking for Momentum Conflicts
Another important MACD concept is divergence. Divergence occurs when price and the MACD indicator appear to be moving in different directions.
Traders watch divergence because it can sometimes provide an early warning that the momentum behind an existing trend is weakening.
Bullish MACD Divergence
A bullish divergence can occur when price forms a lower low while MACD forms a higher low.
This suggests that although price has moved to a new low, the underlying downward momentum may not be as strong as it was during the previous decline.
Some traders interpret this as a warning that sellers may be losing momentum and that a potential bullish reversal or recovery could develop.
However, bullish divergence does not guarantee that price will reverse. A market can continue falling even after divergence appears, particularly during a strong bearish trend.
Bearish MACD Divergence
A bearish divergence can occur when price forms a higher high while MACD forms a lower high.
This can suggest that the market is reaching new price highs without receiving the same level of underlying momentum.
Traders may therefore treat bearish divergence as a warning that bullish momentum is weakening and that a correction or reversal could become more likely.
As with bullish divergence, bearish divergence is best regarded as a warning signal rather than a guaranteed reversal prediction.
Using MACD to Confirm a Trend
MACD can be particularly useful when it is used as a trend-confirmation tool rather than as a standalone entry indicator.
Consider a market that is clearly trending upward. Price is making higher highs and higher lows, while the MACD remains above the zero line. If bullish MACD crossovers occur during pullbacks, the indicator may be reinforcing the existing bullish structure.
The same principle can be applied to a downtrend. If price is forming lower highs and lower lows while MACD remains below zero, bearish crossovers during upward retracements may provide additional confirmation of the prevailing trend.
This approach can be more robust than attempting to trade every crossover because it gives the trader a broader market context.
A Simple MACD Trend-Following Framework
A basic framework for using MACD in a trending market can be structured around several stages.
Step 1: Identify the Market Structure
Begin with price rather than the indicator. Determine whether the market is generally trending upward, trending downward, or moving sideways.
An uptrend is commonly characterized by higher highs and higher lows, while a downtrend tends to produce lower highs and lower lows.
Step 2: Check the MACD Position
After identifying the broader trend, examine whether MACD supports that direction.
For a bullish market, traders may prefer MACD to remain above zero. For a bearish market, traders may prefer MACD to remain below zero.
Step 3: Look for a Crossover
A trader can then monitor the MACD Line and Signal Line for a crossover that agrees with the broader trend.
For example, during an established uptrend, a bullish crossover following a pullback may be more relevant than a bearish crossover occurring against the broader trend.
Step 4: Examine Price Confirmation
Before entering a trade, examine price action for additional confirmation. This could include a break of resistance, a bullish or bearish candlestick pattern, a support or resistance reaction, or continuation of the existing market structure.
Step 5: Define the Trade Before Entering
A complete trading plan should define the entry, invalidation level, stop-loss placement, and potential exit conditions before a position is opened.
MACD should help inform the analysis, but it should not replace a complete trading plan.
MACD Across Different Timeframes
MACD can be applied to virtually any timeframe, but the meaning of a signal can change depending on the chart being analyzed.
On very short-term charts, MACD can respond quickly to price fluctuations and may produce more frequent signals. However, these signals can also contain more market noise.
On higher timeframes, MACD signals generally develop more slowly. Although this can mean fewer trading opportunities, the signals may provide a broader perspective on market momentum.
A trader analyzing the daily chart, for example, may use MACD to understand the broader momentum environment while using a lower timeframe to study potential entries.
This is sometimes referred to as multi-timeframe analysis.
The key is consistency. Traders should understand the timeframe they are using and avoid assuming that a MACD signal on a five-minute chart carries the same significance as one appearing on a daily or weekly chart.
Using MACD in Forex Trading
MACD is widely used in forex trading because currency markets frequently experience directional movements and momentum shifts that can be studied using technical indicators.
For example, a forex trader may use MACD on a major currency pair to identify the prevailing momentum before examining support and resistance or price action for a potential trade.
A bullish MACD structure combined with a series of higher highs and higher lows could strengthen a bullish market view. Conversely, bearish MACD conditions combined with lower highs and lower lows could support a bearish bias.
Nevertheless, forex traders should remember that currency markets can be strongly affected by interest-rate decisions, inflation data, employment reports, central-bank policy, geopolitical developments, and unexpected economic news.
Technical indicators can react to these events after the price has already moved. MACD should therefore be considered alongside the broader market environment.
Using MACD in Stock and Commodity Markets
The same principles can be applied to stocks, indices, commodities, and other actively traded markets.
For a stock, for example, a trader might use MACD to assess whether momentum is supporting a broader price trend. In commodities such as gold or oil, MACD can similarly be used to study momentum shifts and potential trend continuation.
The indicator itself does not change its fundamental purpose. What changes is the behavior of the market being analyzed, including its volatility, liquidity, trading hours, and sensitivity to economic or fundamental developments.
Advanced Ways to Use the MACD
Once traders understand MACD crossovers, the zero line, and the histogram, the indicator can be taken a step further. Instead of looking for a single signal, traders can study how several MACD characteristics interact with price action.
This approach can help distinguish between a simple short-term momentum fluctuation and a potentially more meaningful change in market conditions.
MACD Zero-Line Crossovers
A zero-line crossover occurs when the MACD Line moves from negative territory into positive territory or from positive territory into negative territory.
When MACD crosses above zero, it means the faster 12-period EMA has moved above the slower 26-period EMA. This can support the view that bullish momentum is becoming more dominant.
When MACD crosses below zero, the opposite relationship is occurring, potentially indicating increasing bearish momentum.
Zero-line crossovers can sometimes provide a broader trend confirmation than a standard MACD/Signal Line crossover. However, they may also occur after a significant portion of a price move has already taken place because MACD is derived from moving averages and is therefore a lagging indicator.
MACD Pullback Strategy
One practical way to use MACD is to look for opportunities during temporary pullbacks within an established trend.
The basic concept is straightforward: rather than chasing price after a strong move, the trader waits for the market to temporarily move against the prevailing trend and then looks for momentum to return in the original direction.
Bullish Pullback Example
Imagine that an asset is in a clear uptrend, with price forming higher highs and higher lows. MACD is above zero, confirming that bullish momentum is dominant.
Price then pulls back toward a previously established support area. During the pullback, the MACD Line moves closer to the Signal Line.
If price begins to stabilize at support and the MACD Line subsequently crosses back above the Signal Line, the combination may provide a potential bullish continuation setup.
The important point is that the MACD crossover is not being considered in isolation. The trade idea is supported by the existing trend and the reaction of price around a potentially significant level.
Bearish Pullback Example
The same principle can be applied to a downtrend.
Suppose an asset is making lower highs and lower lows while MACD remains below zero. Price then rallies temporarily toward a resistance area.
If the rally causes MACD to move toward its Signal Line and the MACD Line subsequently crosses below the Signal Line as price begins to weaken, traders may interpret the setup as potential bearish trend continuation.
Again, the broader price structure is more important than the crossover alone.
MACD and Support and Resistance
MACD can become more useful when combined with support and resistance analysis.
Support and resistance provide information about where buying and selling pressure has previously appeared. MACD, meanwhile, provides information about momentum.
Combining the two can create a more complete analytical framework.
For example, a trader may observe price approaching a major support level while bearish MACD momentum is beginning to weaken. If price then produces a bullish reversal pattern and MACD crosses above its Signal Line, the combined evidence may be more meaningful than either signal on its own.
Likewise, if price reaches a major resistance area while bullish MACD momentum begins weakening, a bearish crossover could provide additional confirmation of a potential correction.
This does not eliminate the possibility of a failed setup. Markets can break through support and resistance unexpectedly, which is why risk management remains essential.
MACD and Price Action
Price action refers to the study of how price behaves on a chart without relying exclusively on indicators.
MACD can complement price action by providing additional information about momentum.
Consider a market that has been rising strongly. Price forms a new high, but the MACD histogram begins producing smaller positive bars. This could indicate that bullish momentum is weakening even though price remains above previous highs.
A trader might then monitor price for additional evidence, such as a failed breakout, bearish reversal pattern, or break of a short-term support level.
In this situation, MACD acts as an early alert, while price action provides confirmation.
Combining MACD With the Relative Strength Index (RSI)
Traders can also combine MACD with the Relative Strength Index (RSI) to compare trend momentum with overbought and oversold conditions. Understanding how RSI works can provide useful additional context when interpreting MACD signals.
Some traders combine MACD with the Relative Strength Index (RSI) because the two indicators measure different aspects of market behavior.
MACD primarily focuses on the relationship between moving averages and momentum, while RSI measures the magnitude of recent price gains and losses to assess momentum conditions.
A trader might therefore use MACD to identify the broader momentum direction and RSI to examine whether momentum is becoming stretched or whether a potential pullback is developing.
For example, if MACD is bullish and price is trending upward, an RSI pullback from a relatively elevated reading may not necessarily invalidate the bullish trend. Instead, it could simply indicate a temporary cooling of momentum.
Conversely, if MACD is bearish and RSI is also showing persistent weakness, the two indicators may provide supporting evidence for a bearish market bias.
The goal should not be to collect as many indicators as possible. Too many indicators can create conflicting signals and make analysis unnecessarily complicated.
Combining MACD With Moving Averages
Because MACD itself is derived from moving averages, combining it with a separate moving-average framework can provide additional trend context.
For example, a trader could use a longer-term moving average to establish the broader market direction and then use MACD to study momentum within that direction.
If price remains above the longer-term moving average and MACD is above zero, the combined evidence may support a bullish bias.
If price remains below the longer-term moving average while MACD stays below zero, the evidence may support a bearish bias.
This approach can help prevent traders from treating short-term MACD fluctuations as major trend reversals.
Combining MACD With Bollinger Bands
Another possible combination is MACD with Bollinger Bands.
Bollinger Bands can provide information about price volatility and the relative position of price within a moving-average-based range, while MACD focuses primarily on momentum and trend characteristics.
For example, if price approaches the lower portion of a Bollinger Band during a broader uptrend and MACD begins showing improving bullish momentum, a trader may investigate whether the market is attempting to resume its upward movement.
Similarly, price approaching the upper portion of the bands during a broader downtrend while MACD momentum weakens could warrant closer attention to a possible bearish continuation or correction.
Neither indicator guarantees the outcome. Their purpose is to provide different perspectives on the same market.
Another momentum indicator traders may study alongside MACD is the Stochastic Trading Indicator. Learning how different momentum indicators behave can help traders develop a more complete approach to technical analysis.
MACD Divergence in Greater Detail
Divergence deserves particular attention because it can sometimes reveal a difference between price direction and momentum strength.
A market can continue making new highs while momentum gradually becomes weaker. Likewise, a market can continue making new lows while selling momentum loses strength.
This is where divergence becomes potentially useful.
Regular Bullish Divergence
Regular bullish divergence generally occurs when:
- Price creates a lower low.
- MACD creates a higher low.
The interpretation is that price has moved to a new low, but the downward momentum measured by MACD has not matched the previous decline.
This can warn that bearish momentum is weakening.
Regular Bearish Divergence
Regular bearish divergence generally occurs when:
- Price creates a higher high.
- MACD creates a lower high.
This suggests that price has reached a new high while momentum has failed to reach a corresponding new high.
It can therefore serve as a warning that bullish momentum may be losing strength.
Hidden Divergence
More advanced traders may also study hidden divergence, which is often used as a potential trend-continuation signal.
A bullish hidden divergence can occur when price forms a higher low while the indicator forms a lower low. A bearish hidden divergence can occur when price forms a lower high while the indicator forms a higher high.
The underlying idea is that the prevailing trend may remain intact even though momentum temporarily behaves differently.
Because divergence can be interpreted in different ways and can remain visible for an extended period, traders should seek confirmation rather than entering a position solely because divergence appears.
MACD as a Confirmation Tool
One of the safest ways to think about MACD is as a confirmation tool.
Instead of asking, “Does MACD say buy?”, a trader can ask:
This subtle change in thinking can make technical analysis more disciplined.
For example, if price breaks above resistance and begins forming higher highs, a bullish MACD crossover may provide additional confirmation. If price breaks below support while MACD crosses below its Signal Line, the bearish scenario may receive additional confirmation.
On the other hand, if price is moving sideways and MACD repeatedly crosses back and forth around its Signal Line, the indicator may be providing little useful directional information.
When MACD Works Best
MACD tends to be most informative when the market has a recognizable directional movement. Trending conditions allow the relationship between the moving averages to develop more clearly.
MACD can be particularly useful for:
- Identifying changes in momentum.
- Confirming existing trends.
- Studying bullish and bearish crossovers.
- Monitoring momentum during pullbacks.
- Identifying potential divergence.
- Assessing whether momentum is strengthening or weakening.
- Supporting price-action and support/resistance analysis.
When MACD Can Become Less Reliable
MACD can become less useful when the market lacks a clear trend.
During a sideways or range-bound market, the MACD Line and Signal Line may repeatedly cross each other. These frequent crossovers can create a series of signals without a sustained price movement in either direction.
This phenomenon is commonly referred to as whipsaw.
A trader who reacts to every crossover during such conditions may enter and exit positions repeatedly while price remains trapped within a relatively narrow range.
This is one of the most important reasons why MACD should always be interpreted within the broader market context.
Building a Practical MACD Trading Strategy
Understanding what MACD represents is only the first step. The more important question is how traders can incorporate the indicator into a structured decision-making process without treating it as a standalone prediction tool.
A practical MACD strategy should begin with the market environment, followed by trend identification, price structure, momentum confirmation, and a clearly defined trade plan.
Step 1: Determine the Market Environment
Before examining a MACD crossover, determine whether the market is trending or ranging.
A trending market generally displays a sequence of higher highs and higher lows in an uptrend or lower highs and lower lows in a downtrend. A ranging market tends to move between identifiable support and resistance levels without establishing a sustained directional trend.
This distinction matters because MACD is generally more useful when there is meaningful directional momentum.
If the market is repeatedly moving sideways and MACD is constantly crossing its Signal Line, traders may want to reduce the importance assigned to those individual crossovers.
Step 2: Identify the Dominant Trend
Once the market environment has been established, examine the broader trend.
For a potential bullish setup, traders may look for:
- Higher highs and higher lows.
- Price holding above important support areas.
- MACD remaining above or moving toward the zero line.
- Increasing bullish momentum.
For a potential bearish setup, traders may look for:
- Lower highs and lower lows.
- Price respecting important resistance areas.
- MACD remaining below or moving toward the zero line from above.
- Increasing bearish momentum.
Step 3: Wait for a Pullback or Market Trigger
Instead of entering immediately after identifying a trend, some traders wait for price to retrace toward a significant technical area.
This could be a previous support or resistance level, a trendline, a moving average, or another area where price has previously reacted.
The purpose of waiting is to avoid chasing an extended move and to allow the market to provide a clearer risk and reward structure.
Step 4: Look for MACD Confirmation
After price reaches an area of interest, MACD can be monitored for evidence that momentum is returning in the direction of the broader trend.
For a bullish setup, this could involve a bullish MACD crossover or a transition from weakening to strengthening positive momentum.
For a bearish setup, traders may look for a bearish crossover or increasing negative momentum.
The exact signal should depend on the trader’s strategy and timeframe rather than a rigid rule that applies to every market.
Step 5: Wait for Price Confirmation
MACD confirmation can be strengthened by observing how price behaves.
Examples of price confirmation include:
- A breakout above resistance.
- A break below support.
- A bullish or bearish candlestick pattern.
- A successful retest of a broken level.
- Continuation of the existing market structure.
The objective is to avoid entering solely because an indicator has changed direction.
A Hypothetical Bullish MACD Setup
Consider a hypothetical currency pair that has been trending upward on the daily chart.
Price has formed several higher highs and higher lows. It then pulls back toward a previous support level.
During the pullback, the MACD histogram contracts, suggesting that bullish momentum has temporarily weakened. The MACD Line also moves closer to the Signal Line.
Price reaches the support area and begins showing signs of stabilization. The MACD Line then crosses above the Signal Line while the histogram begins expanding again.
A trader could interpret these combined developments as evidence that bullish momentum may be returning.
However, the trader would still need to determine where the trade idea becomes invalid, where a stop-loss might logically be placed, and what conditions would justify taking profits or exiting the position.
This is an example of how MACD can contribute to a trading process rather than functioning as the entire strategy.
A Hypothetical Bearish MACD Setup
Now consider a hypothetical asset that is in a sustained downtrend.
Price has been creating lower highs and lower lows. It then rallies toward a resistance area.
During the rally, bearish MACD momentum weakens temporarily. The MACD Line moves closer to the Signal Line.
Price reaches resistance and begins to reject the area. The MACD Line subsequently crosses below the Signal Line, while the histogram begins expanding below zero.
This combination could provide additional evidence that the broader bearish trend may be resuming.
Again, the MACD signal is not a guarantee. The trader should wait for an appropriate confirmation and define the risk before entering.
Using MACD for Entry Timing
MACD can sometimes help traders refine the timing of an entry after a broader market bias has already been established.
For example, a trader may determine from a higher timeframe that the overall trend is bullish. Rather than entering immediately, the trader waits for a pullback on a lower timeframe.
The trader can then monitor MACD for a shift back toward bullish momentum.
This approach separates two different analytical tasks:
- Direction: What is the broader market doing?
- Timing: When might momentum be returning in that direction?
MACD is generally more suited to the second question than to predicting the exact future direction of price.
Using MACD for Exit Decisions
MACD can also be used to monitor an existing position.
Suppose a trader is holding a long position during an uptrend. If the MACD histogram begins contracting significantly and the MACD Line eventually crosses below the Signal Line, the trader may treat this as evidence that bullish momentum is weakening.
Depending on the trading plan, this could prompt the trader to review the position, tighten a stop, take partial profits, or prepare for a possible exit.
Similarly, a trader holding a short position may monitor MACD for signs that bearish momentum is weakening.
Importantly, a MACD crossover should not automatically force an exit. A strong trend can experience temporary momentum fluctuations without reversing.
Exit decisions should therefore be based on the complete trading plan rather than on a single indicator reading.
MACD and Risk Management
No technical indicator can remove the risks associated with financial markets. Even a high-quality MACD setup can fail.
This makes risk management an essential part of any strategy that incorporates MACD.
A disciplined trader should determine the maximum acceptable risk before opening a position. This can include defining a logical stop-loss level, controlling position size, and avoiding excessive exposure to a single trade or market.
The stop-loss should generally be based on the structure of the trade rather than simply being placed at an arbitrary distance from the entry.
For example, in a bullish setup, a trader may consider whether a break below a relevant swing low would invalidate the original trade idea. In a bearish setup, a move above a significant swing high could invalidate the bearish thesis.
The precise approach will vary according to the market, timeframe, volatility, and individual trading plan.
MACD and Risk-to-Reward Considerations
A technically attractive setup is not necessarily a good trade if the potential reward does not justify the risk.
Before entering a position, traders can compare the amount they are prepared to risk with the potential profit available if the trade moves in their favor.
For example, if a setup requires risking a relatively large amount to target a small potential gain, the trade may have an unattractive risk-to-reward profile even if the MACD signal looks convincing.
This is why MACD should be integrated into a broader trading framework rather than treated as the deciding factor.
Common MACD Mistakes Traders Should Avoid
1. Trading Every Crossover
One of the most common mistakes is assuming that every bullish crossover means “buy” and every bearish crossover means “sell.”
In ranging markets, MACD can produce numerous crossovers with little sustained price movement. Traders who act on every signal may experience repeated losses.
2. Ignoring the Overall Trend
A MACD crossover that goes against a strong higher-timeframe trend may have a lower probability of producing a sustained reversal.
Understanding the broader trend can help traders distinguish between a temporary correction and a genuine change in market direction.
3. Entering Too Late
Because MACD is calculated using moving averages, its signals can lag price.
Waiting for excessive confirmation can sometimes result in entering after a significant portion of the move has already occurred.
Traders therefore need to balance confirmation with timing rather than assuming that more confirmation is always better.
4. Treating Divergence as a Guaranteed Reversal
Divergence can warn that momentum is weakening, but it does not guarantee that price will reverse.
Strong trends can continue despite divergence, sometimes for considerably longer than expected.
5. Using Too Many Indicators
Adding MACD, RSI, multiple moving averages, Bollinger Bands, stochastic oscillators, and numerous other indicators does not automatically improve analysis.
Too many indicators can create contradictory signals and make decision-making more difficult.
A simpler system with clearly defined rules can often be easier to understand, test, and execute consistently.
6. Ignoring Fundamental Events
Technical indicators reflect price behavior, but markets can move sharply in response to fundamental developments.
Interest-rate decisions, economic releases, corporate announcements, geopolitical events, and unexpected news can produce rapid price movements that overwhelm previously established technical signals.
Traders should therefore understand the major events that could affect the market they are trading.
Testing a MACD Strategy Before Using Real Money
Before relying on a MACD strategy with real capital, traders can evaluate it using historical data or a demo trading environment.
Backtesting allows a trader to examine how a defined set of rules would have performed across different market conditions.
A useful test should specify the MACD settings, timeframe, entry conditions, exit conditions, stop-loss methodology, position-sizing rules, and the markets being tested.
Changing the rules after every losing trade can create a misleading impression of performance. The objective is to determine whether a strategy has a consistent underlying logic rather than simply optimizing it to historical results.
Demo trading can then provide an opportunity to practice execution and discipline without immediately exposing real capital to market risk.
Adjusting MACD Settings
The standard MACD settings of 12, 26, and 9 are widely used, but they are not universal laws.
Changing the settings can make the indicator more responsive or slower.
A faster configuration may react more quickly to price changes but can also generate more noise and false signals. A slower configuration may reduce some short-term fluctuations but can delay signals.
Traders should therefore avoid changing MACD settings simply because a particular combination appears to produce better results over a short historical period.
Any alternative settings should be tested carefully across different market conditions before being incorporated into a trading plan.
The Bigger Picture: MACD Is a Tool, Not a Trading System
Perhaps the most important lesson about MACD is that the indicator itself is not a complete trading system.
A trading system requires much more than an indicator. It should define how markets are selected, how trends are identified, what constitutes an entry, where the trade becomes invalid, how position size is determined, and when a position should be closed.
MACD can contribute valuable information to each of these decisions, particularly when analyzing momentum and trend conditions, but it cannot make those decisions automatically.
The idea of a “magic” indicator is therefore better understood as a useful metaphor rather than a promise of effortless profits. There is no technical indicator capable of eliminating uncertainty from financial markets.
Key Takeaways: Understanding the MACD
The Moving Average Convergence Divergence indicator can be a valuable addition to a trader’s technical-analysis toolkit when it is used correctly and in the right market context.
The most important lessons from this guide include:
- MACD measures momentum and trend characteristics by comparing two exponential moving averages.
- The standard MACD settings are 12, 26, and 9. These represent the fast EMA, slow EMA, and Signal Line respectively.
- The MACD Line is calculated by subtracting the 26-period EMA from the 12-period EMA.
- The Signal Line is normally a 9-period EMA of the MACD Line and is commonly used to identify potential momentum shifts.
- The Histogram shows the difference between the MACD Line and Signal Line and can help visualize changes in momentum.
- The zero line helps traders determine whether the faster EMA is above or below the slower EMA.
- Bullish crossovers occur when the MACD Line moves above the Signal Line, while bearish crossovers occur when it moves below the Signal Line.
- MACD divergence can sometimes warn that momentum is weakening even while price continues moving in the prevailing direction.
- MACD works particularly well as a confirmation tool when combined with price structure, support and resistance, and broader trend analysis.
- MACD can produce false signals, particularly when markets are moving sideways or experiencing short-term volatility.
- MACD is a lagging indicator because it is derived from moving averages, meaning some signals may appear after price has already begun moving.
- Risk management remains essential. No MACD signal guarantees a profitable outcome.
- Backtesting and demo practice can help traders evaluate a strategy before committing real capital.
Frequently Asked Questions About MACD
1. What does MACD stand for?
MACD stands for Moving Average Convergence Divergence. It is a technical-analysis indicator used primarily to study momentum and trends by comparing exponential moving averages.
2. Is MACD a leading or lagging indicator?
MACD is generally considered a lagging indicator because it is calculated from historical price data and moving averages. It can help identify changes in momentum and trend conditions, but it does not reliably predict future prices.
3. What are the standard MACD settings?
The commonly used settings are 12, 26, and 9. The first number represents the fast EMA, the second represents the slow EMA, and the third represents the Signal Line period.
4. What does a bullish MACD crossover mean?
A bullish MACD crossover occurs when the MACD Line crosses above the Signal Line. It may indicate that bullish momentum is increasing, but the signal should be evaluated alongside price action and the broader market trend.
5. What does a bearish MACD crossover mean?
A bearish MACD crossover occurs when the MACD Line crosses below the Signal Line. It may indicate weakening bullish momentum or increasing bearish momentum. However, it is not by itself a guarantee that price will decline.
6. What does it mean when MACD crosses above zero?
When MACD moves above zero, the 12-period EMA is generally above the 26-period EMA. This can indicate that bullish momentum is becoming more dominant.
7. What does it mean when MACD crosses below zero?
When MACD moves below zero, the 12-period EMA is generally below the 26-period EMA. This can indicate that bearish momentum is becoming more dominant.
8. What does the MACD histogram tell traders?
The histogram represents the difference between the MACD Line and the Signal Line. Expanding bars can indicate increasing momentum, while contracting bars can indicate that momentum is weakening. The direction and location of the histogram should always be considered in context.
9. Can MACD predict market reversals?
MACD cannot reliably predict reversals. Divergence and changes in momentum can provide warnings that a trend may be losing strength, but markets can continue in the same direction despite those signals.
10. Is MACD good for forex trading?
MACD can be useful in forex trading for studying trends and momentum. However, currency markets are also strongly influenced by economic data, interest-rate decisions, central-bank policy, geopolitical developments, and other fundamental factors.
11. Can MACD be used for stocks and commodities?
Yes. MACD can be applied to many markets, including stocks, stock indices, commodities, forex, and cryptocurrencies. Its interpretation remains broadly similar, although each market has its own volatility and fundamental characteristics.
12. What is the best timeframe for MACD?
There is no single “best” timeframe for MACD. The appropriate timeframe depends on the trader’s strategy and objectives. Shorter timeframes generally produce more frequent signals and potentially more noise, while higher timeframes provide a broader view but may produce fewer and slower signals.
13. Should MACD be used alone?
It is generally better to avoid relying exclusively on MACD. Combining it with price action, market structure, support and resistance, and appropriate risk-management rules can provide a more complete trading framework.
14. Can MACD be used for short-term trading?
Yes, MACD can be used on shorter timeframes, but traders should be aware that lower timeframes can contain more market noise and false signals. A strategy should be properly tested before being used with real money.
15. Is MACD suitable for beginners?
MACD can be suitable for beginners because its basic concepts are relatively straightforward once the components are understood. Beginners should first learn how the indicator works and practice interpreting it on historical charts or demo accounts before risking real capital.
Final Thoughts: Is MACD Really a “Magic” Indicator?
The MACD has earned a reputation as one of the most useful and enduring indicators in technical analysis. Its ability to combine trend and momentum information explains why it continues to appear on trading charts decades after its development.
But calling it a “magic” indicator should not be taken literally.
MACD cannot know what the market will do next. It cannot guarantee that a crossover will produce a profitable move, and it cannot eliminate the uncertainty inherent in financial markets.
What MACD can do is help traders organize information. It can show whether momentum is generally strengthening or weakening, whether short-term and longer-term price trends are moving closer together or further apart, and whether price and momentum may be sending conflicting messages.
The most effective use of MACD therefore comes from context rather than prediction.
A trader who understands market structure, identifies important price levels, monitors fundamental conditions, and applies disciplined risk management can use MACD as one component of a broader analytical process.
Ultimately, successful trading is not about finding one perfect indicator. It is about developing a repeatable process, managing risk, controlling emotions, and continuously evaluating whether a strategy performs effectively under different market conditions.
SkyPress Trading Perspective
The MACD can be a powerful analytical tool, but no indicator should be treated as a shortcut to guaranteed profits. Use MACD to support your analysis, not to replace it. Study price behavior, understand the market environment, test your approach, and always consider the possibility that a trade can move against you.
SkyPress Disclaimer
Disclaimer: The information provided in this article is for educational and informational purposes only and should not be considered financial, investment, trading, or legal advice. Financial markets, including forex, stocks, commodities, indices, and cryptocurrencies, involve substantial risk and can result in the loss of capital.
The examples and explanations presented in this article are intended to demonstrate how the MACD indicator may be interpreted and should not be understood as recommendations to buy, sell, or hold any financial instrument. Past market behavior does not guarantee future results.
Before making any financial decision, readers should conduct their own research and consider their financial objectives, experience, risk tolerance, and individual circumstances. Where appropriate, consider consulting a qualified financial professional.
SkyPress by Skyrexx does not guarantee the accuracy, completeness, or future performance of any trading method, strategy, indicator, or market interpretation discussed in this article. Readers are solely responsible for their own financial and trading decisions.
By using this information, you acknowledge that trading and investing involve risk and that you should never risk money you cannot afford to lose.
Conclusion
The Moving Average Convergence Divergence indicator remains one of the most versatile tools available to technical traders. From basic crossovers to histogram analysis, zero-line movements, and divergence, MACD provides several ways to examine the relationship between price momentum and trend direction.
Its greatest strength, however, is not its ability to generate isolated signals. It is its ability to add another layer of information to a broader market-analysis process.
Whether you trade forex, stocks, commodities, indices, or other financial markets, understanding what MACD is showing—and equally important, what it is not showing—can help you make more informed and disciplined analytical decisions.
There may be no truly “magic” trading indicator, but when understood properly, MACD can certainly be a valuable part of a trader’s toolkit.