
The Stochastic Trading Indicator: How to Use It Successfully in Forex Trading

Mastering the Stochastic Indicator: How Forex Traders Use Momentum to Spot Potential Reversals
Learn how the Stochastic Oscillator measures momentum, how to interpret overbought and oversold conditions, how to read crossovers and divergence, and how to combine stochastic signals with price action and market context for more disciplined forex analysis.
80 / 20
Common Stochastic Zones14,3,3
Common Default SettingMomentum
Primary Market Signal
Introduction: Understanding Momentum Before the Reversal
Forex markets are constantly moving, but not every movement represents a meaningful change in market direction. A currency pair can rise strongly and still experience temporary pullbacks. It can also fall for an extended period while short-term rallies appear along the way. For traders, one of the most important challenges is distinguishing ordinary price fluctuations from meaningful changes in momentum.
This is where the Stochastic Oscillator can become useful. Rather than simply telling traders whether a currency pair is going up or down, the indicator compares the closing price with its recent trading range. This provides a way of assessing where current price action sits within that range and whether momentum may be changing.
The Stochastic Oscillator is particularly popular among forex traders because it can help highlight potential momentum shifts, overbought and oversold conditions, crossovers and divergence. However, an important distinction must be made from the beginning: an overbought or oversold reading is not automatically a reversal signal.
In a powerful uptrend, for example, the stochastic can remain above 80 while price continues to advance. Likewise, a strong downtrend can keep the oscillator below 20 for an extended period. The indicator therefore works best when it is interpreted alongside market structure, support and resistance, trend conditions and price action.
In this guide, we will move from the fundamentals of the indicator to practical methods for reading stochastic signals on forex charts. We will also examine its calculation, common settings, crossovers, divergence and ways of combining the indicator with broader technical analysis.
1. What Is the Stochastic Oscillator?
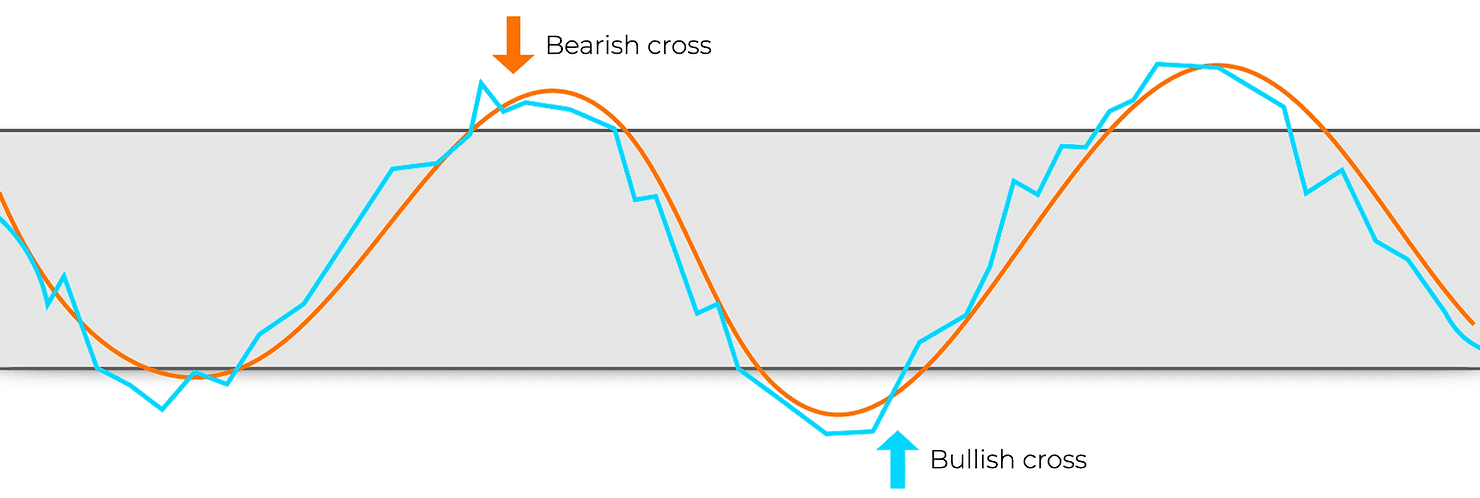
The Stochastic Oscillator is a momentum indicator developed by George Lane in the late 1950s. Its basic purpose is to compare the most recent closing price with the high-low range recorded over a specified number of periods.
The underlying idea is relatively simple. When price closes consistently near the upper end of its recent range, upward momentum may be strong. When price closes closer to the lower end of its recent range, downward momentum may be dominant.
The indicator moves between 0 and 100. Traders commonly use 80 and 20 as reference levels, although these levels should be treated as analytical zones rather than automatic buy and sell triggers.
The Two Main Stochastic Lines
Most stochastic indicators displayed on trading platforms contain two lines: %K and %D. Understanding the difference between them is essential because many traditional stochastic signals are based on the interaction between these two lines.
| Component | Meaning |
|---|---|
| %K | The main stochastic calculation showing where the current closing price sits within the recent high-low range. |
| %D | A moving average of %K that smooths the indicator and is commonly used as the signal line. |
| Range | The look-back period used to calculate the oscillator, commonly 14 periods. |
What Do 80 and 20 Mean?
The 80 and 20 levels are among the most recognizable features of the Stochastic Oscillator. A reading above 80 is commonly described as overbought, while a reading below 20 is commonly described as oversold.
These terms can be misleading if interpreted too literally. Overbought does not mean that price must immediately fall, and oversold does not mean that price must immediately rise. Instead, the readings indicate that price is trading near an extreme relative to the recent range.
2. How the Stochastic Oscillator Is Calculated
You do not need to calculate the Stochastic Oscillator manually every time you trade because modern charting platforms perform the calculation automatically. Nevertheless, understanding the mathematics makes the indicator much easier to interpret.
The standard %K calculation is based on three pieces of information: the current closing price, the highest price during the selected look-back period and the lowest price during that same period.
A Simple Example
Suppose a currency pair has traded between 1.0800 and 1.1000 during the selected look-back period, while the current closing price is 1.0960.
The close is therefore positioned relatively close to the top of the recent range. The stochastic reading would consequently be high, reflecting strong upward positioning within that particular range.
This example also illustrates an important limitation: the oscillator is measuring price relative to a historical range. It does not independently know whether the broader market is beginning a reversal or simply continuing a strong trend.
Understanding %D
The %D line is generally a moving average of %K. A common configuration uses a three-period moving average, which is why the popular stochastic configuration is often displayed as 14, 3, 3.
The smoothing process makes the indicator easier to read by reducing some of the short-term fluctuations in the raw calculation. Traders then watch for situations where %K and %D cross, particularly when the crossover occurs near an important market level.
| Setting | General Role |
|---|---|
| 14 | Look-back period used for the primary stochastic calculation. |
| 3 | Common smoothing period applied to the main stochastic line. |
| 3 | Common smoothing period associated with the signal line. |
3. How to Read the Stochastic Oscillator on a Forex Chart
Reading the stochastic effectively requires more than checking whether the indicator is above 80 or below 20. Experienced technical traders examine where the oscillator is located, how it is moving, how the two lines interact and what price itself is doing at the same time.
3.1 Overbought and Oversold Conditions
| Stochastic Zone | What It May Indicate |
|---|
| Setting Approach | Characteristics | Main Consideration |
|---|---|---|
| Faster | Reacts quickly to recent price changes. | More responsive but potentially noisier. |
| 14, 3, 3 | Balanced responsiveness and smoothing. | Useful starting point for many traders. |
| Slower | Produces smoother momentum readings. | Signals may appear later. |
Rather than constantly changing settings to make historical signals look better, traders should choose a configuration, test it consistently and evaluate how it performs under different market conditions.
7. Using the Stochastic Indicator Across Different Timeframes
The same stochastic indicator can behave very differently depending on the timeframe being analyzed. A reading on a five-minute chart represents a very different market environment from the same reading on a daily chart.
This is why traders should select their timeframe according to their trading style rather than assuming that one timeframe is automatically superior.
| Timeframe | Typical Use | Stochastic Consideration |
|---|---|---|
| 5–15 Minutes | Short-term and intraday analysis. | Signals can be frequent and sensitive to market noise. |
| 1 Hour | Intraday trend and pullback analysis. | Often provides a useful balance between detail and noise. |
| 4 Hour | Swing and broader intraday analysis. | Can help identify larger momentum swings. |
| Daily | Swing and longer-term market analysis. | Signals generally contain less short-term market noise. |
7.1 A Practical Multi-Timeframe Approach
One practical approach is to use a higher timeframe to understand the broader direction and a lower timeframe to look for a more precise setup.
For example, a trader could examine the daily or four-hour chart to determine whether the market is generally bullish or bearish. The trader could then move to the one-hour chart to study a pullback and look for a stochastic signal that aligns with the broader market structure.
8. How to Use the Stochastic Indicator in a Trending Market
One of the biggest mistakes beginners make is assuming that stochastic overbought and oversold readings should always be traded against the trend. Strong trends can keep the oscillator at extreme levels for much longer than expected.
A more practical approach is to use the stochastic to identify potential pullbacks within the prevailing trend.
8.1 Bullish Trend Example
Imagine that EUR/USD is making a sequence of higher highs and higher lows. Price remains above an important moving average and previous resistance has turned into support.
During a temporary pullback, the stochastic falls toward or below 20. Instead of immediately buying simply because the indicator is oversold, the trader waits to see whether price reaches a meaningful support area and whether the stochastic begins turning upward.
If price then produces a bullish rejection and the stochastic crosses upward, the combination may provide stronger evidence than the oversold reading alone.
8.2 Bearish Trend Example
The opposite situation can occur in a downtrend. Suppose GBP/USD is forming lower highs and lower lows while remaining below a significant moving average. A temporary rally pushes the stochastic above 80.
Rather than buying simply because price is rising temporarily, the trader can monitor whether the rally reaches resistance and whether the stochastic begins turning downward.
A bearish price-action signal combined with a stochastic bearish crossover may provide confirmation that the pullback is losing momentum and that the broader downtrend could resume.
Trend-Following Framework
Identify the trend → wait for a pullback → observe the stochastic → locate support or resistance → wait for price confirmation → evaluate the trade.
9. Using the Stochastic Indicator in a Ranging Market
The Stochastic Oscillator can be particularly useful when a currency pair is moving sideways between clearly defined support and resistance levels.
In a range-bound market, price repeatedly travels between the upper and lower boundaries. The stochastic can help traders monitor momentum as price approaches these boundaries.
9.1 Potential Long Setup
- Identify a well-defined support zone.
- Wait for price to approach or test that support.
- Observe whether stochastic moves into or below the oversold area.
- Look for evidence that downward momentum is weakening.
- Wait for price confirmation before considering an entry.
9.2 Potential Short Setup
- Identify a well-defined resistance zone.
- Wait for price to approach or test that resistance.
- Observe whether stochastic reaches or moves above the overbought area.
- Look for evidence that upward momentum is weakening.
- Wait for price confirmation before considering an entry.
The critical point is that the stochastic should not be used to define the range itself. Price action establishes the support and resistance structure, while the stochastic can provide additional information about momentum within that structure.
10. Building a Stochastic Crossover Strategy
The stochastic crossover is one of the simplest ways to incorporate the indicator into a trading framework. However, the quality of a crossover depends heavily on where and when it occurs.
Bullish Crossover Checklist
- Price is approaching or holding an important support area.
- The stochastic has moved into or near the lower zone.
- %K crosses above %D.
- Price produces a bullish confirmation signal.
- The broader market context does not strongly contradict the setup.
Bearish Crossover Checklist
- Price is approaching or holding an important resistance area.
- The stochastic has moved into or near the upper zone.
- %K crosses below %D.
- Price produces a bearish confirmation signal.
- The broader market context supports or at least does not strongly contradict the setup.
This framework helps prevent one of the most common stochastic mistakes: entering a position solely because two indicator lines have crossed. A crossover is information about momentum. It is not, by itself, a complete trading system.
11. Practical Stochastic Trade Walkthrough
The best way to understand the Stochastic Indicator is to see how its signals can fit into a complete market-analysis process. The following example is educational and uses hypothetical price levels to demonstrate the decision-making process rather than to provide a live trading recommendation.
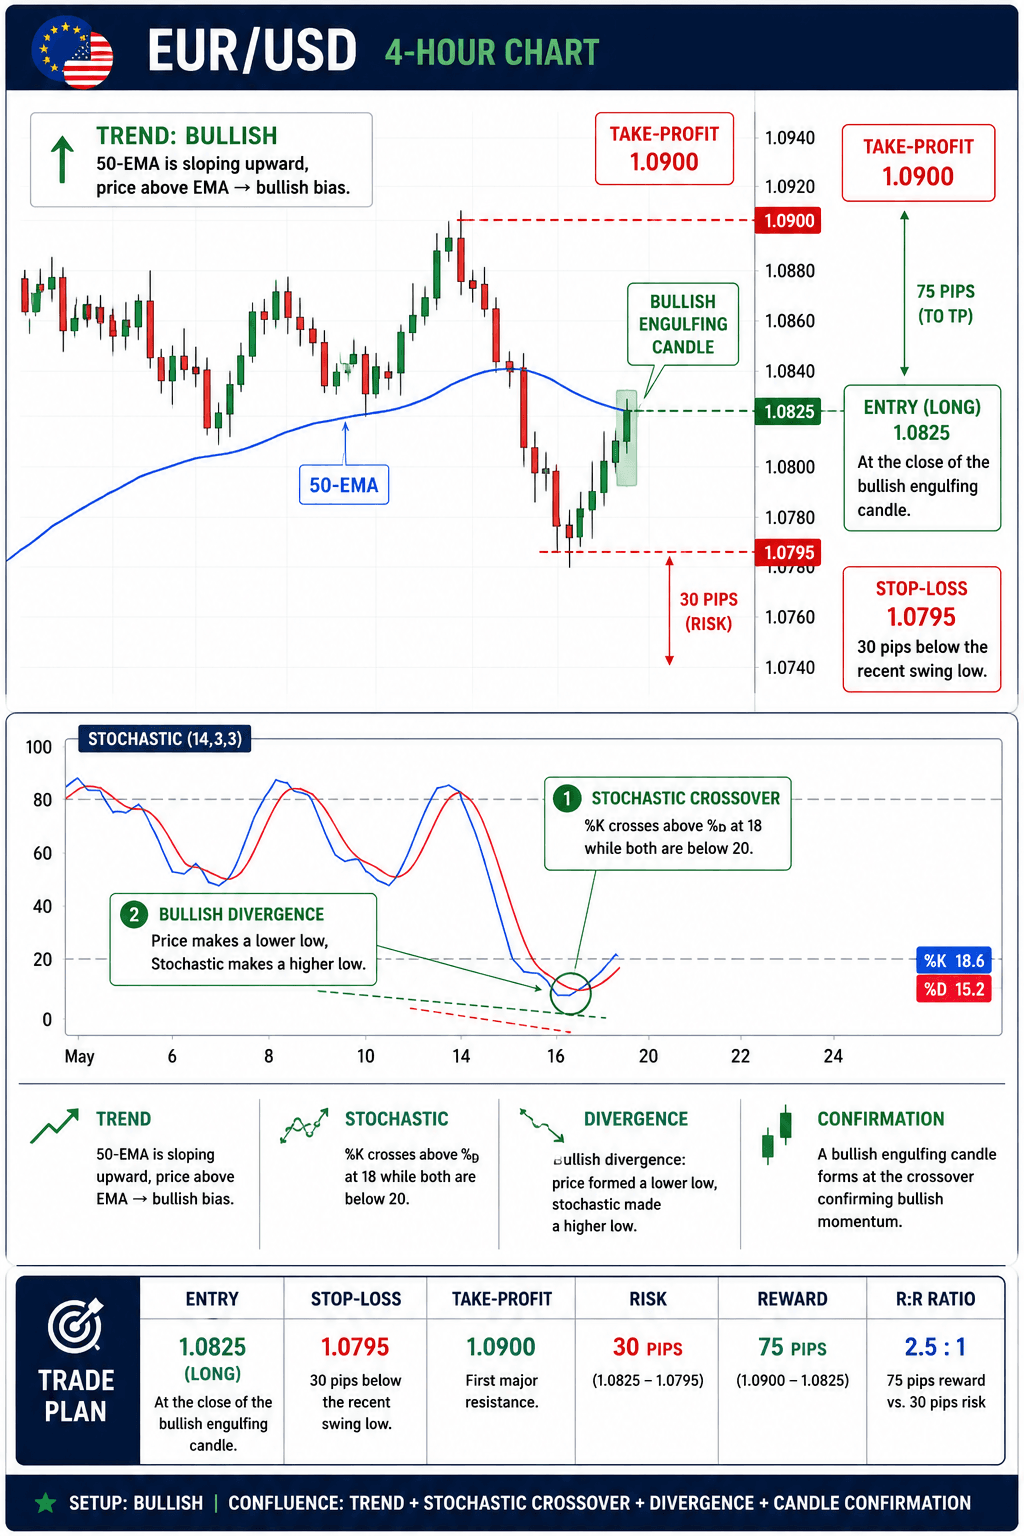
11.1 Example: EUR/USD on the 4-Hour Chart
Imagine that a trader is analyzing EUR/USD on a four-hour chart. The broader structure is bullish, with price forming a series of higher highs and higher lows. Price is also trading above a rising 50-period exponential moving average (EMA), providing additional evidence of positive momentum.
| Observation | Example Reading |
|---|---|
| Currency Pair | EUR/USD |
| Timeframe | 4-Hour |
| Market Structure | Higher highs and higher lows |
| Moving Average | Price above a rising 50 EMA |
| Stochastic | Pullback toward the oversold zone |
11.2 Waiting for the Pullback
Instead of buying while price is already moving strongly upward, the trader waits for a pullback. During the retracement, the stochastic falls toward the 20 level as short-term selling pressure increases.
Importantly, the trader does not immediately buy simply because the oscillator has entered the oversold area. The next question is where the pullback is occurring on the price chart.
If price approaches a previously identified support area while the broader bullish structure remains intact, the stochastic reading becomes more relevant. The indicator is now providing momentum information within a meaningful price location.
11.3 Waiting for Confirmation
Suppose price reaches support and forms a bullish rejection candle. At the same time, %K begins moving above %D while the stochastic recovers from the lower zone.
The trader now has several pieces of information pointing in the same direction: the broader trend is bullish, price is testing support, selling momentum appears to be weakening and the stochastic is beginning to turn upward.
This does not guarantee that the trade will succeed. It simply creates a more complete technical setup than relying on a stochastic reading alone.
11.4 The Hypothetical Entry
For illustration, assume the bullish confirmation candle closes around 1.0825. A trader following this hypothetical setup could consider that candle close as a potential confirmation point rather than entering earlier while price is still falling.
A protective stop would need to be positioned according to the actual market structure and volatility, rather than being placed at an arbitrary fixed distance. Likewise, any potential target should be based on logical price levels and the trader’s predefined trading plan.
12. How to Use Stochastic Divergence More Effectively
Divergence can provide an additional layer of analysis because it compares price behaviour with momentum. When price continues making new extremes while the stochastic fails to confirm those extremes, traders may begin watching for signs that the current move is losing momentum.
12.1 Bullish Divergence
Bullish divergence occurs when price creates a lower low while the stochastic creates a higher low. This suggests that although price has moved to a new downside extreme, the momentum behind that move is not matching the previous decline.
A trader may then monitor the chart for additional evidence such as a bullish candlestick pattern, a break of a short-term trendline or a recovery above a nearby resistance level.
12.2 Bearish Divergence
Bearish divergence occurs when price forms a higher high while the stochastic forms a lower high. This indicates that price has reached a new high without the oscillator confirming the same level of momentum.
Again, divergence should be treated as a warning or observation rather than an automatic short signal. Confirmation from price structure can help traders distinguish a genuine momentum deterioration from temporary divergence within an ongoing trend.
| Type | Price | Stochastic | Possible Interpretation |
|---|---|---|---|
| Bullish | Lower low | Higher low | Downward momentum may be weakening. |
| Bearish | Higher high | Lower high | Upward momentum may be weakening. |
13. Combining the Stochastic Indicator With Other Technical Tools
The Stochastic Oscillator becomes more useful when it is part of a broader analytical framework. The objective is not to place as many indicators as possible on a chart. Instead, each tool should answer a different question.
13.1 Stochastic + Moving Average
A moving average can help identify the broader directional environment while the stochastic focuses on shorter-term momentum.
For example, a trader may look for bullish stochastic setups when price is above a rising moving average and bearish stochastic setups when price is below a declining moving average.
13.2 Stochastic + Support and Resistance
Support and resistance provide the price-location component that the stochastic does not provide by itself.
A stochastic oversold reading near meaningful support can be more informative than the same reading occurring in the middle of an established downtrend. Similarly, an overbought reading near resistance may deserve closer attention than one occurring in the middle of a powerful bullish breakout.
13.3 Stochastic + Price Action
Candlestick behaviour can provide confirmation for momentum signals. Examples include rejection candles, engulfing patterns and strong breakout candles. The exact pattern is less important than whether the price action supports the broader market thesis.
13.4 Avoiding Indicator Overload
Adding several oscillators that all measure similar aspects of momentum does not necessarily improve analysis. In many cases, it simply creates conflicting signals and makes decision-making more complicated.
A cleaner chart containing price structure, one trend tool and the stochastic can often provide enough information to develop a repeatable technical process.
14. Common Mistakes When Using the Stochastic Indicator
The Stochastic Oscillator is relatively easy to understand, but using it successfully requires discipline. Many poor results come not from the indicator itself but from misunderstanding what its readings actually mean.
Mistake 1: Selling Every Overbought Reading
An overbought reading indicates that price is near the upper portion of its recent range. It does not automatically mean that the market must fall. Strong trends can remain overbought for extended periods.
Mistake 2: Buying Every Oversold Reading
The same principle applies to oversold conditions. A currency pair can remain oversold while sellers continue controlling the market.
Mistake 3: Trading Every Crossover
Crossovers can occur frequently, particularly on lower timeframes. Without market context, many of these signals can become meaningless or short-lived.
Mistake 4: Ignoring the Higher Timeframe
A lower-timeframe stochastic signal can appear attractive while the higher timeframe is moving strongly in the opposite direction. Reviewing the broader market structure can help place short-term signals into context.
Mistake 5: Constantly Changing Settings
Traders sometimes adjust indicator settings after every losing trade. This can lead to over-optimization and inconsistent results. A better approach is to establish a logical configuration, test it across different market conditions and make changes only when there is a clear reason.
15. Advanced Ways to Use the Stochastic Indicator
Once traders understand basic overbought, oversold and crossover signals, the Stochastic Oscillator can be used in more refined ways. These techniques focus less on isolated readings and more on how momentum behaves within the broader market structure.
15.1 Stochastic as a Pullback Timing Tool
In a strong trend, traders may not want to enter after an extended price movement. Instead, they can wait for a temporary retracement and use the stochastic to monitor whether short-term momentum has moved against the prevailing trend.
For example, during a bullish trend, the stochastic may fall toward the oversold area while price approaches support. If the broader structure remains bullish and price begins showing signs of rejection, the oscillator turning upward can provide additional timing information.
15.2 Stochastic Failure Swings
Traders can also pay attention to how the oscillator behaves after reaching an extreme. A failure to continue in the same direction can sometimes signal a change in short-term momentum.
A potential bullish failure swing may occur when stochastic enters the lower zone, begins recovering, pulls back without reaching the previous extreme and then moves higher again. A bearish version follows the opposite sequence near the upper zone.
These patterns should still be evaluated against price structure. The oscillator alone does not establish whether a market reversal will occur.
15.3 Watching Momentum Around the 50 Level
Although traders often focus heavily on the 20 and 80 levels, the middle of the oscillator can also provide useful context. Sustained movement above the midpoint may indicate that bullish momentum is dominating the recent trading range, while sustained movement below it can indicate stronger bearish momentum.
The 50 level should not be treated as a standalone buy or sell trigger. Instead, it can be used as another piece of information when assessing momentum.
16. Combining Stochastic With Market Structure
Successful technical analysis usually begins with price rather than the indicator. Before interpreting a stochastic signal, traders should understand what the market is doing.
Market structure can be simplified into three broad environments: uptrend, downtrend and range.
| Market Environment | Price Behaviour | Possible Stochastic Application |
|---|---|---|
| Uptrend | Higher highs and higher lows. | Monitor pullbacks and bullish momentum recoveries. |
| Downtrend | Lower highs and lower lows. | Monitor rallies and bearish momentum recoveries. |
| Range | Price moves between support and resistance. | Watch momentum near range boundaries. |
This approach prevents the indicator from being interpreted in isolation. The same stochastic reading can have very different implications depending on the structure surrounding it.
17. A Complete Stochastic Trading Workflow
Rather than reacting to every stochastic movement, traders can create a repeatable workflow. The objective is to make the indicator part of a structured decision-making process.
Step 1: Identify the Market Environment
Determine whether the currency pair is trending upward, trending downward or moving sideways. Look at swing highs, swing lows and the overall direction of price before considering the oscillator.
Step 2: Mark Important Price Levels
Identify relevant support and resistance zones, previous swing points, breakout areas and other locations where price has historically reacted.
Step 3: Monitor the Stochastic
Observe whether the oscillator is approaching an extreme, crossing its signal line, recovering from an extreme or showing divergence with price.
Step 4: Wait for Price Confirmation
Look for evidence from the price chart before treating the stochastic signal as actionable. This can include a rejection candle, a break of a minor structure level or continuation from a well-defined support or resistance area.
Step 5: Define the Trade Before Entering
Decide where the setup becomes invalid, where a potential target could be located and how much capital is appropriate for the trade before placing an order.
Step 6: Record the Outcome
Keep a trading journal containing the currency pair, timeframe, market environment, stochastic reading, entry reasoning and outcome. Reviewing multiple trades can reveal whether the strategy performs consistently or whether certain market conditions produce weaker signals.
The SkyPress Framework
Price structure first → Stochastic second → Confirmation third → Trade plan before execution → Review the result.
18. When You Should Be Cautious With Stochastic Signals
No technical indicator performs equally well under every market condition. The Stochastic Oscillator can produce misleading signals when price is being driven by unusually strong momentum, sudden volatility or major fundamental developments.
18.1 Strong Breakouts
During a powerful breakout, stochastic can quickly enter an extreme zone and remain there while price continues in the same direction. Fading the breakout simply because the indicator is overbought or oversold can therefore be risky.
18.2 Major Economic Events
Interest-rate decisions, inflation releases, employment reports and other major economic announcements can cause sudden price movements. Technical indicators calculated from previous candles may not fully reflect the new information immediately.
18.3 Extremely Low Timeframes
Very short timeframes can contain considerable market noise. Stochastic crossovers may occur repeatedly without producing meaningful directional moves. Traders using lower timeframes should therefore understand the additional uncertainty involved.
19. Stochastic vs. Other Momentum Indicators
The Stochastic Oscillator is one of several tools traders can use to study momentum. Comparing indicators can help explain why traders may choose one tool over another for a particular strategy.
| Indicator | Main Focus | Common Application |
|---|---|---|
| Stochastic | Closing price relative to a recent range. | Momentum shifts, pullbacks and potential reversal areas. |
| RSI | Momentum based on recent price changes. | Momentum strength, extremes and divergence. |
| MACD | Relationship between moving averages. | Trend and momentum changes. |
These indicators are not interchangeable in every situation. The most useful choice depends on the trading strategy, timeframe and type of information the trader needs from the chart.
20. Understanding the Limitations of the Stochastic Indicator
The Stochastic Oscillator can be a valuable technical-analysis tool, but it should never be treated as a prediction machine. It is calculated from historical price data and therefore describes what price has already done.
Several limitations are important to understand:
- It can remain overbought or oversold: Extreme readings do not guarantee immediate reversals.
- It can produce false crossovers: Especially during choppy or low-quality market conditions.
- It reacts to historical prices: A new fundamental development can quickly change the market environment.
- It does not determine position size: Trade sizing and capital allocation require a separate trading plan.
- It cannot eliminate uncertainty: Even a technically strong setup can fail.
Understanding these limitations is not a reason to avoid the indicator. Instead, it helps traders use stochastic more realistically—as one component of a broader analytical process.
21. A Practical Stochastic Trading Checklist
Before acting on a Stochastic signal, traders can use a simple checklist to determine whether the setup fits their broader trading plan. The purpose is not to eliminate uncertainty but to encourage consistency and reduce impulsive decisions.
Before Considering a Trade
- Market structure: Is the market trending upward, trending downward or ranging?
- Key levels: Is price near meaningful support, resistance or another important price area?
- Stochastic location: Is the oscillator near an extreme or moving through the middle of its range?
- Signal: Has a crossover, momentum shift or divergence actually developed?
- Price confirmation: Is price behaviour supporting the stochastic signal?
- Higher timeframe: Does the broader chart provide useful context?
- Trade invalidation: What market movement would prove the original setup wrong?
- Trading conditions: Is unusual volatility or a major economic event likely to affect the setup?
If several important conditions are missing, waiting may be more appropriate than forcing a trade. One of the most valuable skills in technical trading is recognizing when there is no sufficiently clear setup.
22. Key Takeaways: Using the Stochastic Indicator Successfully
The Stochastic Oscillator is a relatively simple indicator, but using it effectively requires more than watching the %K and %D lines cross. Its greatest value comes from combining momentum information with price structure, market context and disciplined decision-making.
- Stochastic measures momentum: It compares the closing price with its recent trading range.
- 80 and 20 are reference zones: Overbought does not automatically mean sell, and oversold does not automatically mean buy.
- 14, 3, 3 is a common starting point: Traders can test different configurations, but should avoid constantly changing settings based on individual trade outcomes.
- Context matters: A stochastic signal can behave very differently in a strong trend compared with a ranging market.
- Crossovers need confirmation: A crossover is information about momentum, not a guarantee of a profitable trade.
- Divergence can provide additional information: Differences between price and stochastic momentum may indicate that the current move deserves closer attention.
- Multiple timeframes can improve context: A higher timeframe can help establish the broader market environment while a lower timeframe can assist with timing.
- Price should remain central: Support, resistance, market structure and price action should not be ignored simply because an indicator provides a signal.
- Backtesting matters: Traders should test any stochastic strategy across different currency pairs and market conditions before relying on it with real capital.
23. Frequently Asked Questions About the Stochastic Indicator
What is the Stochastic Indicator used for in Forex trading?
The Stochastic Oscillator is primarily used to analyze momentum by comparing a currency pair’s closing price with its recent trading range. Traders use it to study momentum shifts, pullbacks, potential reversal areas, crossovers and divergence.
Is the Stochastic Indicator a buy and sell signal?
Not by itself. An overbought, oversold or crossover reading should generally be interpreted as part of a broader analysis. Market structure, support and resistance, price action and the prevailing trend can provide important context.
What are the best Stochastic settings for Forex?
There is no single setting that is best for every trader or market. The commonly used 14, 3, 3 configuration is a reasonable starting point. Traders can test faster or slower settings depending on their timeframe and strategy, but should evaluate them systematically rather than relying on hindsight.
Does an overbought Stochastic reading mean I should sell?
No. An overbought reading means that the closing price is near the upper portion of its recent range. In a strong bullish trend, the stochastic can remain above 80 while price continues rising. Additional confirmation is therefore important.
Does an oversold Stochastic reading mean I should buy?
No. A market can remain oversold during a strong downtrend. Traders should examine price structure and wait for evidence that downward momentum is weakening before considering a bullish setup.
Which timeframe is best for the Stochastic Indicator?
There is no universally superior timeframe. Lower timeframes can provide more frequent signals but may contain more market noise, while higher timeframes generally provide broader context. The appropriate timeframe depends on the trader’s strategy and holding period.
Can Stochastic divergence predict a Forex reversal?
Divergence can indicate that price and momentum are behaving differently, but it does not guarantee a reversal. Price can continue moving in the original direction even after divergence appears. Traders should therefore seek additional confirmation.
Can I use Stochastic with another indicator?
Yes. Stochastic can be combined with tools such as moving averages, support and resistance analysis, trendlines and price-action techniques. The goal should be complementary information rather than filling the chart with numerous indicators that produce similar signals.
Is the Stochastic Indicator suitable for beginners?
Yes. Its basic calculation and visual structure are relatively easy to understand. However, beginners should learn how momentum indicators behave in trending and ranging markets before attempting to trade stochastic signals with real money.
Can the Stochastic Indicator be used for scalping?
It can be used on lower timeframes, including those commonly associated with short-term trading. However, lower-timeframe signals can be affected by market noise and rapid price fluctuations. Traders should test their approach carefully before using it in live markets.
What is the most important lesson when using Stochastic?
The most important lesson is to avoid treating the indicator as an independent prediction tool. Stochastic is most useful when its momentum information is interpreted alongside price structure, market conditions and a clearly defined trading plan.
24. Conclusion: Turning Stochastic Signals Into Better Forex Analysis
The Stochastic Oscillator remains one of the most widely recognized momentum indicators in technical analysis because it provides traders with a simple way to examine where the current closing price sits within a recent trading range.
Its usefulness, however, depends on how it is interpreted. Treating every overbought reading as a sell signal or every oversold reading as a buy signal can lead to poor decisions, particularly when markets are trending strongly.
A more disciplined approach is to begin with price structure, identify the broader market environment, locate important support and resistance levels, and then use stochastic to understand momentum within that context.
Traders can further strengthen their analysis by studying crossovers, divergence and multi-timeframe relationships while waiting for confirmation from price action.
Ultimately, the Stochastic Indicator should not be viewed as a tool that predicts the future. It is an analytical instrument that can help traders organize information about momentum and identify areas that deserve closer attention.
Trade the Context, Not Just the Indicator
The strongest use of Stochastic comes from combining momentum analysis with market structure, price action and a consistent trading process.
SkyPress Disclaimer
The information provided in this article is intended for educational and informational purposes only. It is not financial, investment, trading or other professional advice and should not be treated as a recommendation to buy or sell any currency pair, financial instrument or other asset.
Forex and leveraged trading involve substantial risk, including the possibility of losing some or all of the capital committed. Past market behaviour, historical examples, technical indicators and hypothetical trading scenarios do not guarantee future results.
The Stochastic Oscillator and other technical-analysis tools can produce false or delayed signals and should not be relied upon as the sole basis for a trading decision. Market conditions can change rapidly because of economic data, central-bank decisions, geopolitical developments, liquidity conditions and other factors.
Readers should conduct their own research, consider their financial circumstances and risk tolerance, and seek advice from a suitably qualified financial professional where appropriate before making investment or trading decisions.
SkyPress does not guarantee the accuracy, completeness or future performance of any strategy, example or information presented in this article. Trading decisions are made at the reader’s own risk.