
Mastering the Skies: An Expert Guide to Trading the Ichimoku Cloud in Forex
- Deconstructing the Cloud: The Five Core Components
- The Core Trading Signals: Trend, Momentum, and the Kumo Break
- Advanced Analysis 1: Identifying Divergence for Early Warnings
- Advanced Analysis 2: Gauging Trend Strength with the Kumo
FOREX ANALYSIS – In the vast and volatile universe of forex trading, where currency pairs can shift on a macroeconomic whisper, traders are perpetually in search of an edge. While no indicator is a crystal ball, few tools offer the comprehensive, all-in-one analytical power of the Ichimoku Kinko Hyo, or “Ichimoku Cloud.” More than just a trend indicator, this sophisticated Japanese charting system provides a dynamic view of market momentum, support/resistance, and potential future price action. For the international forex trader, mastering the Cloud can be akin to learning a new language—the language of the market itself.
Developed by Goichi Hosoda in the late 1930s and meticulously refined over decades, the Ichimoku system was designed to generate signals with a single glance. Its name translates to “one-balance chart,” reflecting its aim to present a balanced, immediate picture of the market. For forex traders operating across different time zones and sessions, this holistic view is invaluable.
This expert analysis will deconstruct the Ichimoku Cloud, moving beyond the basics to explore its advanced applications in identifying divergence, gauging trend strength, and anticipating powerful reversals in the world’s most liquid market.
Deconstructing the Cloud: The Five Core Components
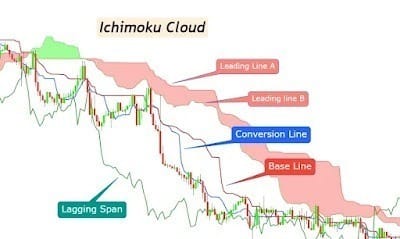
Before diving into strategy, one must understand the five lines that form the Ichimoku system. Each is calculated to project a specific aspect of market equilibrium.
Tenkan-sen (Conversion Line): The midpoint of the last 9 periods. It is the fastest and most sensitive line, representing short-term momentum. A steeply rising or falling Tenkan-sen indicates strong immediate momentum.
Kijun-sen (Base Line): The midpoint of the last 26 periods. This is a medium-term momentum indicator and a key support/resistance level. It acts as a confirmation line; price above the Kijun is bullish, below is bearish.
Senkou Span A (Leading Span A): The midpoint of the Tenkan and Kijun, projected 26 periods into the future. This line forms one edge of the Kumo (Cloud).
Senkou Span B (Leading Span B): The midpoint of the last 52 periods, also projected 26 periods into the future. This slower line forms the other edge of the Cloud.
Chikou Span (Lagging Span): The current closing price, plotted 26 periods in the past. This unique component is used to confirm the strength of past signals and identify potential areas of support or resistance.
The area between Senkou Span A and Senkou Span B is the Kumo, or Cloud. This is the heart of the system. The Cloud’s thickness represents the strength of future support or resistance. A thick Cloud indicates a strong zone, while a thin Cloud suggests a weak one. The Cloud’s color (typically green for bullish, red for bearish) is determined by which Senkou Span is on top.
The Core Trading Signals: Trend, Momentum, and the Kumo Break

The most fundamental Ichimoku strategy involves the relationship between price, the Tenkan/Kijun, and the Cloud.
Trend Direction: The primary rule is simple: if price is above the Cloud, the trend is bullish. If price is below the Cloud, the trend is bearish. Price within the Cloud indicates consolidation or trend transition.
The TK Cross: A classic momentum signal occurs when the faster Tenkan-sen crosses the slower Kijun-sen. A bullish TK cross (Tenkan above Kijun) suggests buying momentum, while a bearish TK cross suggests selling momentum. This signal is strongest when it occurs in alignment with the overall trend (i.e., a bullish cross above the Cloud).
The Kumo Breakout: One of the most powerful signals is a clean breakout from the Cloud. A decisive candle closing above a bullish (green) Cloud after a period of consolidation or a downtrend can signal the start of a strong bullish move. Conversely, a break below a bearish (red) Cloud often signals a significant downtrend is beginning. The strength of the Cloud itself acts as a filter for the strength of the breakout.
Advanced Analysis 1: Identifying Divergence for Early Warnings
While many traders use the Cloud for trend-following, its components are exceptional for spotting momentum divergence—a key precursor to a potential reversal.

Divergence occurs when the price of a currency pair (e.g., EUR/USD) makes a new high or low, but the underlying momentum indicator does not confirm it. With Ichimoku, we can use the Tenkan-sen or the Chikou Span for this analysis.
Chikou Span Divergence: This is a uniquely powerful Ichimoku concept. If the EUR/USD price makes a new high, but the Chikou Span (which is the current price lagged 26 periods) fails to make a new high above the price action of 26 periods ago, it indicates weakening bullish momentum. This bearish divergence suggests the buying pressure behind the rally is fading, even though price is still climbing. It is an expert-level warning that a trend may be exhausting itself.
Tenkan-sen Divergence: Similarly, if price makes a series of higher highs, but the Tenkan-sen begins to flatten or make lower highs, it signals that short-term momentum is waning. This often occurs before a TK cross or a price correction.
For the forex trader, these divergence signals are crucial for managing risk and considering taking partial profits before a potential trend shift, especially on higher timeframes like the 4-hour or daily chart.
Advanced Analysis 2: Gauging Trend Strength with the Kumo
The Cloud is not a static entity; its structure provides deep insight into the underlying strength and quality of a trend.
Trend Strength: A strong, healthy bullish trend will typically be characterized by:
Trend Strength: A strong, healthy bullish trend will typically be characterized by:
Price consistently trading above a thick, rising Cloud.
The Cloud itself being green (Senkou A > Senkou B) and expanding in thickness.
The Tenkan-sen remaining above the Kijun-sen.
The Kijun-sen acting as dynamic support.
Conversely, a weak, corrective move higher might see price wobbling near the top of the Cloud or the Cloud itself being thin and flat. This tells an expert trader that the trend lacks conviction and is more susceptible to a reversal.
The Kumo Twist: A critical event in Ichimoku analysis is when Senkou Span A and Senkou Span B cross, causing the Cloud to change color. This “Kumo Twist” often signals a major shift in momentum and can mark a significant support/resistance zone for the next 26 periods. A twist from red to green ahead of price can be a leading indicator of a potential bullish shift.
Advanced Analysis 3: Anticipating and Trading Reversals
The confluence of multiple Ichimoku components creates high-probability reversal setups.
A potential bullish reversal scenario might unfold as follows:
Price is in a Downtrend: EUR/USD is below a red Cloud.
Price Re-enters the Cloud: It breaks into the Kumo, suggesting the downtrend is pausing.
A TK Cross Occurs: A bullish TK cross happens inside the Cloud, showing initial buying momentum.
Price Breaks Above the Cloud: The pair exits the top of the Cloud.
The Chikou Span Breaks Above Price: The Lagging Span clears the price action from 26 periods ago, confirming the strength of the breakout.
The Kumo Twists to Bullish: Senkou Span A crosses above Senkou Span B, turning the Cloud green and providing a new platform of support.
This multi-layered confirmation, where price, the TK cross, the Lagging Span, and the future Cloud are all aligned, offers a far more robust signal than any single component alone. The same logic, in reverse, applies for bearish reversals.
Conclusion: The Balanced Perspective
The Ichimoku Cloud is a remarkably deep and versatile system. For the global forex trader, its greatest strength is its ability to provide a “one-glance” assessment of market conditions, from trend direction and momentum to future areas of conflict.
However, expert analysts caution against its use in isolation. The Ichimoku system, with its reliance on midpoints, can be lagging in extremely fast, news-driven markets. The most successful traders use it as their primary framework but confluence it with other tools. For example, using the Cloud to identify the trend and key support, then using price action patterns (like pin bars or engulfing candles) at the Kijun-sen or Cloud boundary for precise entry timing. Furthermore, aligning Ichimoku signals with key macroeconomic events or fundamental drivers adds another layer of conviction.
Ultimately, trading the Ichimoku Cloud is not about memorizing crossovers; it’s about understanding market equilibrium. It provides a structured, visual narrative of the constant battle between bulls and bears. By learning to read this story, forex traders can navigate the market’s turbulence with greater clarity, confidence, and, most importantly, a balanced perspective.