

Mastering the Markets: A Comprehensive Guide to Technical & Fundamental Analysis
Unlock the strategies professional traders and investors use to analyze financial markets. Learn how technical indicators, price action, economic data, and global events combine to shape market trends and trading opportunities.
Technical Analysis
Study charts, indicators, price action, trends, support & resistance.
Fundamental Analysis
Understand economic news, central banks, inflation, and global markets.
Professional Trading
Combine both approaches to improve accuracy and market decision-making.
Author: SkyPress Team
Category: Trading Education
technical analysis, fundamental analysis, forex trading, stock trading, trading strategies, chart patterns, economic indicators, RSI, MACD, moving averages, support and resistance, trend analysis, day trading, swing trading, market analysis, financial markets
Technical & Fundamental Analysis
Master chart analysis, indicators, market structure, and economic fundamentals.
In the dynamic world of financial markets, the difference between a profitable trader and a struggling one often comes down to one critical factor: analysis. At SkyPress, we believe that knowledge is the foundation of every successful trade. Whether you are interested in forex trading or stock trading, understanding how to read the market is non-negotiable.
We often see beginners jump into trades based on emotion or hearsay. However, professional traders rely on a structured approach. By combining technical and fundamental analysis, we can decode the market’s language and make informed decisions. As Benjamin Franklin wisely said, “An investment in knowledge pays the best interest.”
In this guide, we will break down the two pillars of market analysis and show you how to apply them practically to your trading strategies.
Technical Analysis Basics
Technical analysis is the study of historical price action to forecast future market movements. It operates on the premise that history tends to repeat itself. When we look at a chart, we are looking at the collective psychology of market participants.
At SkyPress, we teach that technical analysis is your primary tool for timing the market. It answers the question: “When should I enter or exit a trade?”
Chart Types
To analyze price, we first need to visualize it. The three most common chart types we use are:
- Line Charts: Simple and clean, connecting closing prices over a set period. Great for identifying overall trends.
- Bar Charts: More detailed, showing the open, high, low, and close (OHLC) for each period.
- Candlestick Charts: The most popular among traders. These provide a visual representation of market volatility and sentiment. A single candlestick can tell us about the battle between buyers and sellers during a specific time frame.
Support and Resistance
One of the first concepts we master is identifying key price levels.
- Support: A price level where buying pressure overcomes selling pressure, causing price to bounce upward.
- Resistance: A price level where selling pressure overcomes buying pressure, causing price to drop.
Drawing these horizontal lines on your chart helps you identify potential entry points and set stop-loss levels.
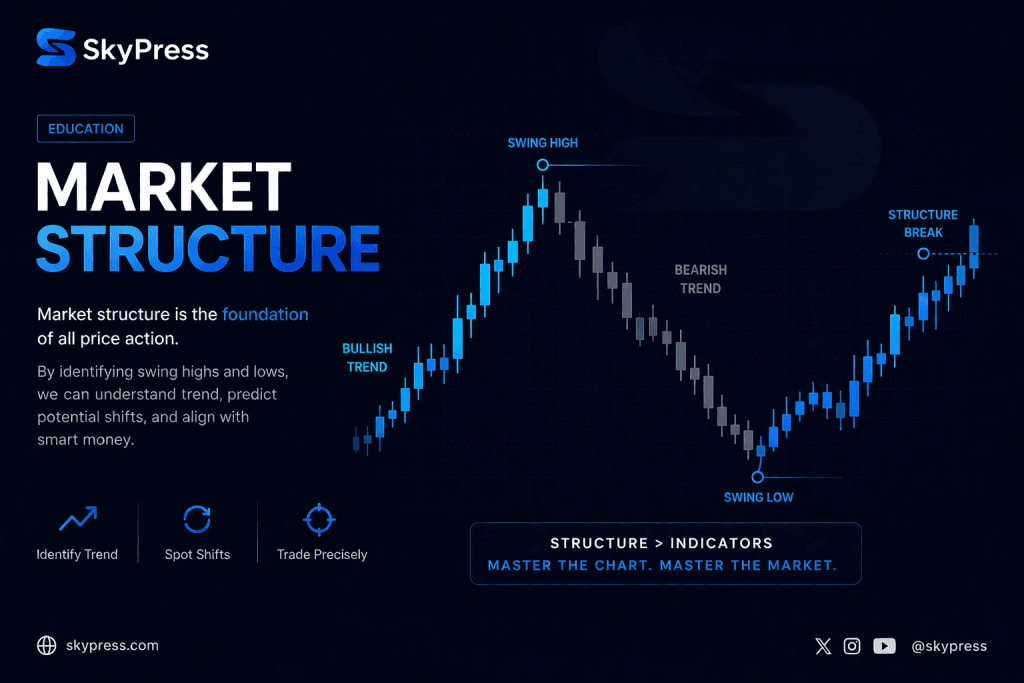
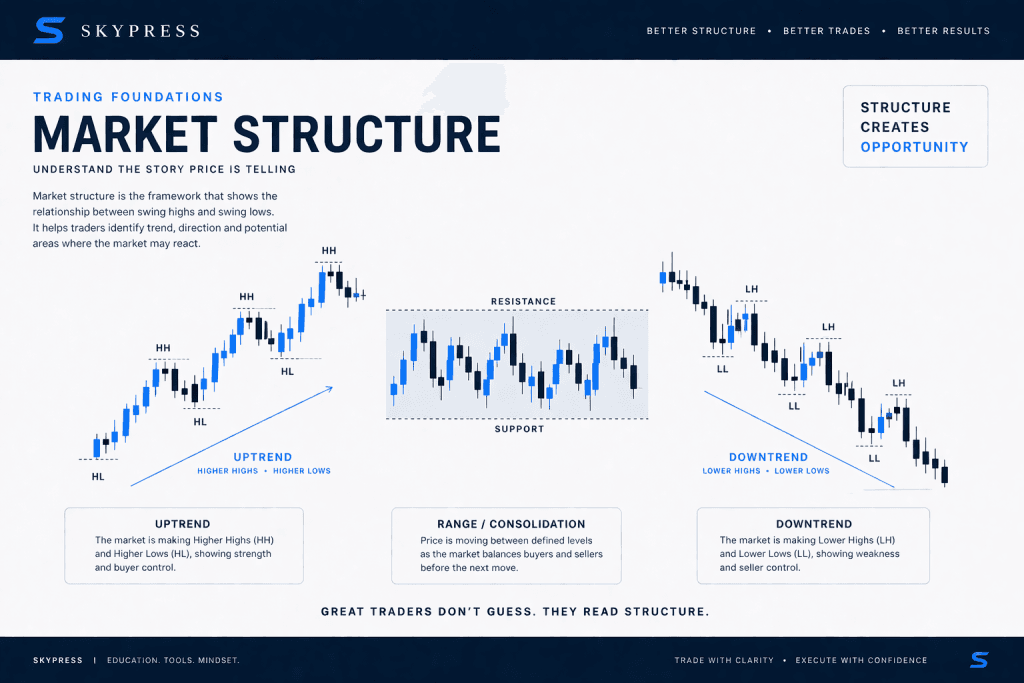
Trend Analysis
Markets rarely move in a straight line. We categorize them into three types:
- Bullish Trend: Higher highs and higher lows.
- Bearish Trend: Lower highs and lower lows.
- Sideways (Range-bound) Market: Price oscillates between support and resistance without a clear direction.
Identifying the trend is crucial because, as the saying goes, “the trend is your friend.”
Practical Personal Finance, Smart Money Tips & Financial Education
Fundamental Analysis Overview
While technical analysis tells us when to trade, fundamental analysis tells us what to trade and why. This approach involves evaluating the economic, social, and political factors that drive supply and demand.
For day traders and swing traders, understanding the “why” behind a sudden price spike is essential to avoid being caught on the wrong side of a move. If you are new to this, we recommend reviewing our Forex Trading Basics page to build a solid foundation.
Key Economic Indicators
Economic data releases are scheduled events that can cause massive volatility. As traders, we must keep an eye on:
- Gross Domestic Product (GDP): The broadest measure of a country’s economic health.
- Consumer Price Index (CPI): A primary measure of inflation. High inflation often leads central banks to raise interest rates.
- Employment Data: In the US, the Non-Farm Payrolls (NFP) report is a market mover. Strong employment figures usually strengthen a currency.
Central Bank Policies
Central banks, such as the Federal Reserve (Fed) or the European Central Bank (ECB), control monetary policy. Interest rate decisions are the most powerful drivers of currency values. When a central bank raises rates, the currency typically appreciates due to foreign investment inflows seeking higher returns.
Geopolitical Events
Elections, trade wars, and global crises introduce uncertainty into the markets. During these times, safe-haven assets (like gold or the USD) often rise, while riskier assets may decline.
Popular Trading Indicators
Indicators are mathematical calculations based on price, volume, or open interest. They help us confirm trends and signal potential reversals. Here are four staples in the SkyPress trading toolkit:
- Moving Averages (MA): These smooth out price data to identify trends.
- Simple Moving Average (SMA): The average price over a specific period.
- Exponential Moving Average (EMA): Gives more weight to recent prices, reacting faster to new information.
- Application: Traders often look for the “crossover” strategy (e.g., when a short-term EMA crosses above a long-term EMA) to signal a buy.
2. Relative Strength Index (RSI): RSI is a momentum oscillator that measures the speed and change of price movements. It ranges from 0 to 100.
- Overbought: RSI above 70 suggests a price may be overextended to the upside.
- Oversold: RSI below 30 suggests a price may be oversold to the downside.
3. MACD (Moving Average Convergence Divergence): This trend-following momentum indicator shows the relationship between two moving averages. It consists of the MACD line and a signal line. When the MACD line crosses above the signal line, it’s a bullish signal; when it crosses below, it’s bearish.
4. Bollinger Bands: These consist of a middle band (SMA) and two outer bands (standard deviations).
- When bands tighten (squeeze), it indicates low volatility and often precedes a large breakout.
- When price touches the upper band, it may indicate overbought conditions; touching the lower band may indicate oversold conditions.
Combining Analyses for Strategy
The most successful traders do not rely on just one method. They combine technical and fundamental analysis to create a robust trading strategy. This holistic approach minimizes risk and maximizes probability.
The Synergy of Timing and Context
Imagine technical analysis as your dashboard and fundamental analysis as your GPS.
- Fundamental Analysis provides the context. It tells us which currency pairs or stocks have the potential for a sustained move based on economic health.
- Technical Analysis provides the timing. It helps us pinpoint the exact moment to enter the trade to maximize reward and minimize risk.
Practical Application: A Step-by-Step Strategy
Let’s apply this to a hypothetical trade scenario in the forex market:
- Identify the Fundamental Bias: Suppose the US releases strong GDP data and positive employment figures. Fundamentally, the US Dollar (USD) is likely to strengthen against other currencies. We establish a bias to sell pairs like EUR/USD or GBP/USD.
- Wait for the Technical Setup: We don’t chase the price. We wait for the chart to confirm our bias.
- We look at the EUR/USD chart. Is the price approaching a key resistance level
- Are the Moving Averages trending downward?
- Is the RSI showing overbought conditions (above 70)?
- Execute the Trade: Once the fundamental bias aligns with a technical signal (e.g., a bearish candlestick pattern at resistance with an RSI divergence), we enter the trade.
- Entry: Sell at the resistance level.
- Stop Loss: Place above the recent swing high (respecting support/resistance).
- Take Profit: Target the next major support level.
Monitor the News: Even after entering, we monitor upcoming economic calendars. If a surprise news event occurs, we adjust our positions accordingly.
Day Trading vs. Swing Trading
- Day Trading: Here, we rely heavily on technical analysis for quick entries and exits, but we must be aware of major news releases that could hit our positions intraday.
- Swing Trading: This involves holding positions for days or weeks. Fundamental analysis becomes more critical here, as macroeconomic shifts drive larger trends.
Conclusion
Mastering the financial markets is a journey, not a sprint. By integrating technical analysis with fundamental analysis, we move beyond gambling and into the realm of strategic trading.
At SkyPress, we are committed to providing you with the tools and knowledge to navigate these waters confidently. Whether you are analyzing chart patterns, interpreting economic indicators, or refining your trading strategies, remember that continuous education is your greatest asset.
that continuous education is your greatest asset.
For a deeper dive into these concepts and to accelerate your learning curve, we invite you to explore our comprehensive Forex Trading Full Course. As Benjamin Franklin noted, “An investment in knowledge pays the best interest.” Invest in yourself today, and the markets will reward you tomorrow.
Disclaimer: Trading financial markets involves a high level of risk and may not be suitable for all investors. This content is for educational purposes only and does not constitute financial advice. Always trade responsibly.