
Forex Chart Analysis: Complete Guide to Reading Forex Charts
Mastering Forex Chart Analysis: A Professional Guide to Reading Price Action
Learn how to read forex charts, understand candlestick behavior, identify market trends, and recognize the important price levels that shape potential trading opportunities.
Forex Chart Analysis: How to Read Price Action and Market Structure
A practical guide to reading forex charts, understanding price behavior, identifying trends, and locating important market levels.

Forex chart analysis is one of the most important skills a trader can develop. The foreign exchange market produces enormous amounts of price information every day, and charts provide a visual framework for understanding that information.
Rather than reacting emotionally to every price movement, traders can use chart analysis to identify market conditions, study price behavior, and build structured trading plans.
Technical analysis does not predict the future with certainty. Instead, it helps traders evaluate probabilities and determine where a trading idea may be valid or invalid.
Core principle: Professional chart analysis is about understanding price behavior, not predicting every single market movement.
What Is Forex Chart Analysis?
Forex chart analysis is the process of studying currency-price movements through charts in order to identify trends, patterns, momentum, market structure, and important support and resistance areas.
For example, a trader analyzing EUR/USD may begin with a daily chart to understand the broader market direction before moving to a four-hour or one-hour chart to study potential trading setups.
This approach provides context. A short-term decline on an hourly chart may simply be a temporary pullback within a larger daily uptrend.
Why Chart Analysis Matters
Without a structured method, traders can easily become distracted by every candle and every short-term price movement. This can encourage overtrading and emotional decision-making.
A disciplined chart-reading process encourages traders to ask important questions before considering a trade.
- What is the overall market direction?
- Is the market trending, ranging, or consolidating?
- Where are the major support and resistance zones?
- What is price doing around those areas?
- Is momentum increasing or weakening?
- Where would the trading idea become invalid?
- Does the potential reward justify the risk?
Understanding Forex Charts
A forex chart displays the movement of a currency pair over a specific period. The horizontal axis represents time, while the vertical axis represents price.
Different timeframes provide different perspectives. A one-minute chart shows short-term price fluctuations, while a daily chart provides a broader view of market behavior.
This is why traders should understand the difference between short-term price movement and the larger market structure.

The Three Main Forex Chart Types
Most trading platforms provide three traditional chart types: line charts, bar charts, and candlestick charts.
1. Line Charts
A line chart connects selected prices, commonly closing prices, across a series of periods. It provides a simple view of the overall direction of a currency pair.
2. Bar Charts
A bar chart displays the open, high, low, and close of each trading period. This gives traders more information than a basic line chart.
3. Candlestick Charts
Candlestick charts are widely used by forex traders because they display the open, high, low, and close in an intuitive visual format.
They are particularly useful for price-action analysis because the candle body and wicks can provide clues about the balance between buyers and sellers.
How to Read a Forex Candlestick
Every standard candlestick contains four essential pieces of information: the opening price, highest price, lowest price, and closing price.
- Open: The price where the selected period began.
- High: The highest price reached during that period.
- Low: The lowest price reached during that period.
- Close: The price where the selected period ended.
The main rectangular section is called the candle body. The lines extending above and below the body are known as wicks, shadows, or tails.
A large bullish candle may indicate strong buying pressure, while a large bearish candle may indicate stronger selling pressure. However, individual candles should always be interpreted within their wider market context.
Candlestick Patterns and Market Psychology
Candlestick patterns help traders interpret the interaction between buyers and sellers. They can provide clues about potential continuation, reversal, or indecision.
However, no candlestick pattern should be treated as an automatic trading signal. Its location, market structure, timeframe, and surrounding price action all matter.
Doji
A doji forms when the opening and closing prices are relatively close. It can represent indecision or temporary balance between buyers and sellers.
Bullish Engulfing Pattern
A bullish engulfing pattern occurs when a bullish candle substantially covers the body of the previous bearish candle. Near meaningful support, it may suggest that buying pressure is increasing.
Bearish Engulfing Pattern
A bearish engulfing pattern occurs when a bearish candle substantially covers the body of the previous bullish candle. Near resistance, it may indicate increasing selling pressure.
Professional rule: Never trade a candlestick pattern simply because it has a familiar name. Always consider the surrounding market structure and risk.
Support and Resistance
Support and resistance are foundational concepts in forex technical analysis. They represent areas where price has previously encountered meaningful buying or selling pressure.
Support is an area where buying pressure has historically helped slow or reverse declining prices.
Resistance is an area where selling pressure has historically helped slow or reverse rising prices.

Support and resistance should generally be viewed as zones rather than perfectly precise lines. Price may temporarily move above or below an important level before reversing.
Traders can study previous swing highs, swing lows, consolidation areas, and repeated price reactions when identifying potentially important zones.
Key lesson: A support or resistance zone is not a guarantee that price will reverse. It is an area where traders may want to pay closer attention to price behavior.
Trend Analysis: Understanding Market Direction
One of the first questions a trader should answer when analyzing a forex chart is: What is the market currently doing? Price generally moves through three broad conditions: trending upward, trending downward, or moving sideways within a range.
Identifying the prevailing market condition helps traders avoid using the same strategy in every environment. A strategy designed for a strong trend may behave very differently when the market enters a narrow range.
Understanding an Uptrend
An uptrend is generally identified by a sequence of higher highs and higher lows. Buyers are progressively pushing price upward while pullbacks are finding support at increasingly higher levels.
Rather than buying simply because price is rising, traders can wait for controlled pullbacks toward important areas and then look for evidence that buyers are regaining control.
Understanding a Downtrend
A downtrend is generally characterized by lower highs and lower lows. Sellers are controlling the broader direction by pushing price downward while preventing sustained advances above previous swing highs.
In a bearish environment, traders may focus more closely on rallies toward resistance and observe whether sellers return to the market.
Understanding a Range
A ranging market occurs when price repeatedly moves between an upper resistance area and a lower support area without establishing a clear directional trend.
Range conditions can create opportunities, but they can also produce false breakouts and frequent reversals. Traders therefore need to recognize when a market has transitioned from trending to consolidating.
Using Trend Lines in Forex Analysis
Trend lines are simple technical tools that can help traders visualize the direction and structure of price movement. They are normally drawn by connecting important swing points on a chart.
In an uptrend, traders may connect significant higher lows to create an ascending trend line. In a downtrend, significant lower highs can be connected to create a descending trend line.
A trend line should not be treated as an exact prediction tool. Markets frequently move slightly beyond trend lines before continuing or reversing. The quality of the surrounding price action remains more important than the line itself.
Trading principle: The more important the market context, the more useful a technical level can become. A trend line is most valuable when it agrees with broader structure, support or resistance, and price-action evidence.
Market Structure and Swing Points
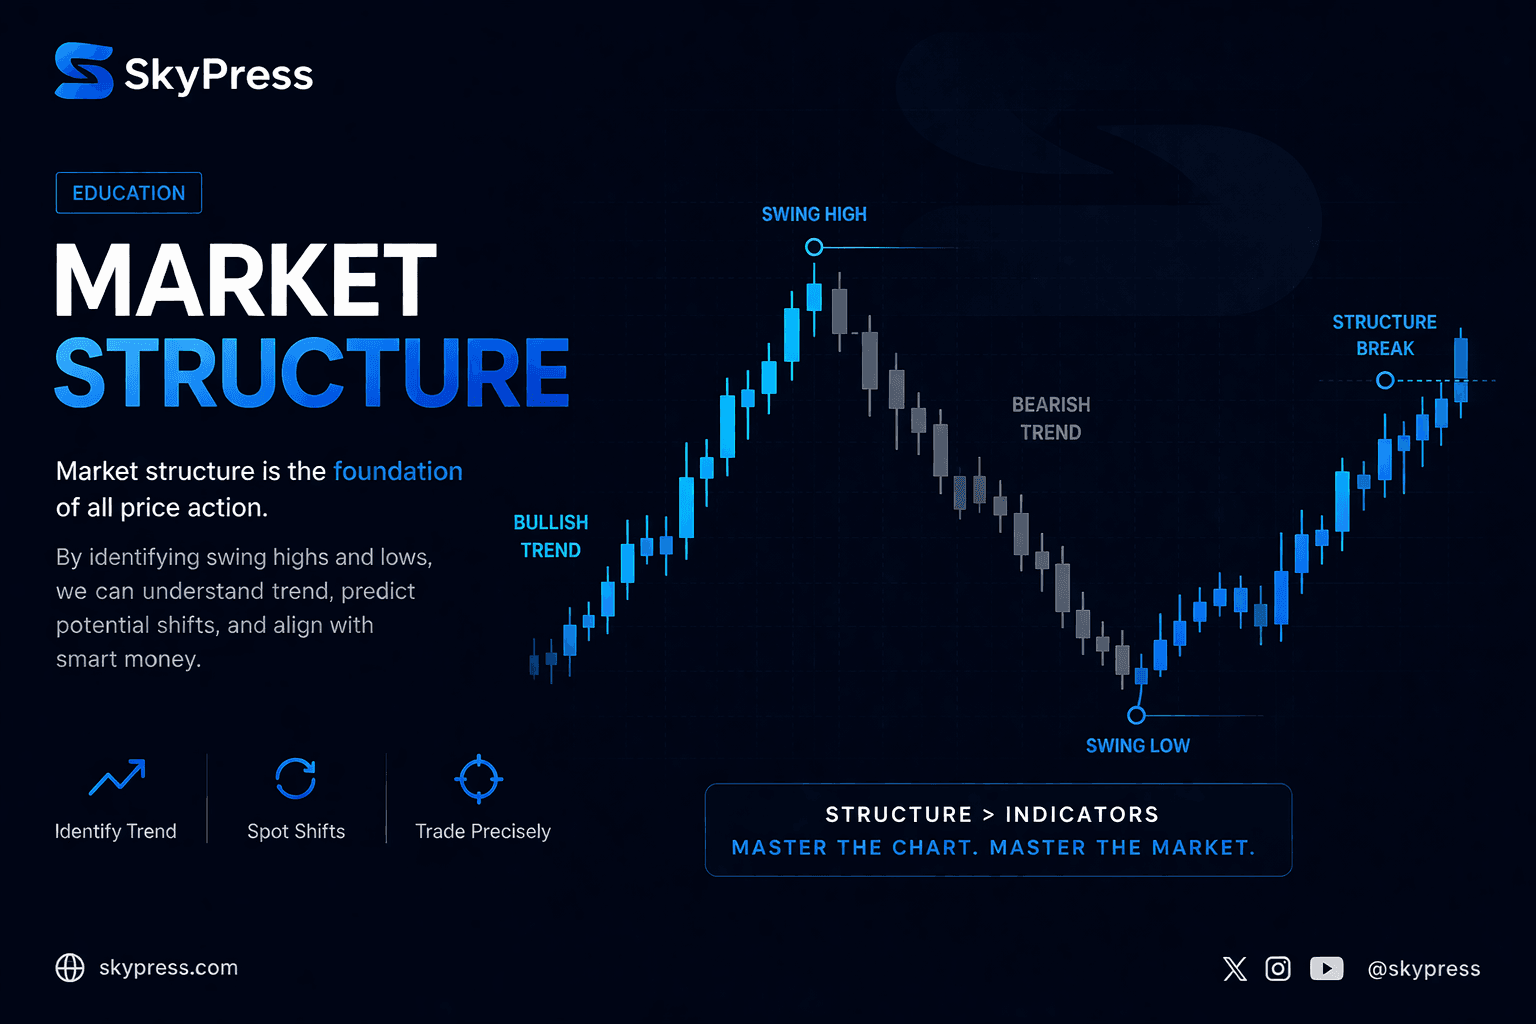
Market structure gives traders a broader framework for interpreting price. Instead of concentrating on individual candles, traders identify meaningful swing highs and swing lows.
A swing high is an area where price rises and then turns lower. A swing low is an area where price declines and then turns higher. These turning points help create the structure visible on a forex chart.
When a series of higher highs and higher lows develops, the market is generally considered bullish. When lower highs and lower lows dominate, the structure is generally bearish.
When neither side establishes sustained control, the market may remain within a range.
Why Market Structure Matters
Market structure helps traders put individual trading signals into context. For example, a bullish candlestick pattern may look attractive on its own, but its significance can change considerably if it appears inside a strong bearish structure.
Likewise, a bearish pattern occurring during a powerful uptrend may simply represent a temporary pullback rather than the beginning of a major reversal.
This is why professional chart analysis combines individual signals with the larger structure of the market.
Breakouts and Breakdowns
A breakout occurs when price moves beyond an established resistance area or another significant price boundary. A breakdown occurs when price moves below an established support area.
Breakouts can sometimes signal that market conditions are changing, but not every breakout results in a sustained trend. Price can move beyond a level and then quickly return to the previous range.
This behavior is commonly referred to as a false breakout. Traders therefore need to distinguish between a genuine structural move and a temporary price spike.
What to Watch During a Breakout
- Closing price: Observe whether the candle closes beyond the important level.
- Market structure: Consider whether the breakout changes the previous sequence of highs and lows.
- Momentum: Look for evidence that price is moving with meaningful strength rather than simply producing a temporary spike.
- Retest: Price may return to the broken level before continuing in the breakout direction.
- Risk: Determine where the trade idea would become invalid before entering.
Multi-Timeframe Chart Analysis
One of the most useful skills in forex technical analysis is learning to examine multiple timeframes. A higher timeframe can provide context, while a lower timeframe can provide more detailed information about potential entries.
For example, a swing trader might begin with the weekly or daily chart to identify the broader market structure. The trader could then move to the four-hour chart to locate important zones and finally use a lower timeframe to study entry behavior.
The exact combination of timeframes depends on the trader’s strategy and holding period. The key principle is consistency: each timeframe should serve a specific purpose rather than being used randomly.
Multi-timeframe rule: Start with the bigger picture before zooming into the entry timeframe. This can help reduce the risk of taking a short-term setup without understanding the larger market environment.
Building a Professional Chart-Reading Routine
A repeatable chart-reading routine can make technical analysis more organized. Instead of immediately searching for a trade, traders can move through a sequence of questions.
- Identify the higher-timeframe market direction.
- Determine whether the market is trending or ranging.
- Mark important support and resistance zones.
- Identify major swing highs and swing lows.
- Study current price action around important levels.
- Look for confirmation that supports the trading idea.
- Define the entry, stop-loss, and potential target before entering.
This process can help traders avoid entering the market simply because price is moving quickly. Patience is an important part of technical analysis because the best setup is often the one that meets several predefined conditions.
Connecting Chart Analysis With Risk Management
Technical analysis should never be separated from risk management. A trader may identify an attractive chart pattern and still experience a loss because markets can behave unpredictably.
This is why traders should determine their potential risk before placing an order. The stop-loss should be connected to the logic of the trading setup rather than being placed randomly.
If you want to build a stronger foundation in this area, continue with the risk management and trading psychology module in the SkyPress Forex Academy.
You can also return to the complete Forex trading course to review the earlier lessons and connect chart analysis with the broader trading process.
Advanced Price Action Analysis
Price action is the study of how price behaves without relying entirely on technical indicators. It focuses on candles, swing points, momentum, breakouts, rejections, and the interaction between buyers and sellers.
The objective is not to memorize hundreds of candlestick formations. Instead, professional traders attempt to understand the story being communicated by price. They ask where buyers became aggressive, where sellers responded, and whether the current movement is consistent with the broader market structure.
Reading Price Rejection
Price rejection occurs when the market moves toward a particular area but fails to remain there. A long wick can sometimes show that price was pushed away from a level during the selected timeframe.
For example, if price moves below a support zone and then closes back above it, the rejection may indicate that sellers were unable to maintain control at lower prices. However, traders should wait for additional context rather than treating one wick as a guaranteed reversal signal.
Reading Momentum
Momentum describes the strength and speed behind price movement. Large candles, strong directional moves, and consecutive closes in the same direction can provide evidence of increased momentum.
Weak momentum may appear through smaller candles, overlapping price action, or repeated failures to continue beyond important levels.
Understanding momentum can help traders distinguish between a meaningful move and a market that is simply drifting without strong directional commitment.
Common Forex Chart Patterns
Chart patterns are formations created by price over time. Some traders use them to identify possible continuation or reversal scenarios.
Patterns should not be viewed as automatic signals. Their reliability depends on the market environment, timeframe, location, and confirmation.
Double Top
A double top can develop when price reaches a resistance area twice but fails to break through decisively. The pattern may suggest weakening bullish momentum if price subsequently breaks an important support level.
Double Bottom
A double bottom can form when price tests a support area twice and fails to continue lower. A subsequent move above an important resistance level may provide additional confirmation that market conditions are changing.
Head and Shoulders
The head and shoulders pattern consists of three major peaks, with the middle peak higher than the two surrounding peaks. Traders often monitor the neckline because a decisive break can signal a potential change in market structure.
Triangles
Triangle formations develop when price gradually compresses into a narrower range. They can occur before significant movements, although the eventual direction should not be assumed simply because a triangle has appeared.
Using Technical Indicators With Price Action
Technical indicators can complement chart analysis by processing price data into visual measurements of trend, momentum, or volatility.
However, adding more indicators does not automatically produce better analysis. Using several indicators that measure similar information can actually create conflicting signals and unnecessary complexity.
Better approach: Use indicators as supporting tools rather than allowing them to replace your understanding of price structure and market context.
Moving Averages
Moving averages smooth historical price data and can help traders identify the general direction of a market.
A rising moving average may support the view that the market has been trending higher, while a declining moving average may support a bearish interpretation. Moving averages can also be used to study dynamic areas of potential support or resistance.
Relative Strength Index (RSI)
The Relative Strength Index, commonly called RSI, is a momentum oscillator. Traders often use it to evaluate the strength of recent price movements and to identify potentially overextended conditions.
An important point is that an overbought reading does not automatically mean that price must fall, and an oversold reading does not guarantee that price must rise. Strong trends can remain overbought or oversold for extended periods.
MACD
The Moving Average Convergence Divergence indicator, or MACD, is commonly used to study momentum and changes in trend behavior.
Traders may examine the relationship between the MACD line, signal line, and histogram when evaluating momentum. Like other indicators, MACD works best when interpreted alongside broader market structure.
Bollinger Bands
Bollinger Bands are designed to provide a visual representation of price volatility around a moving average.
When volatility contracts, the bands may narrow. When volatility expands, the bands may widen. Traders can use this information to study changing market conditions, but a band expansion alone does not determine the direction of the next move.
Choosing the Right Indicators
A professional chart does not need to contain every available indicator. Excessive indicators can make charts difficult to read and may encourage traders to search for confirmation until they find the signal they want.
A simple framework could involve one tool for trend, one for momentum, and price action for confirmation.
For a deeper study of indicators and advanced systems, continue to the Technical Indicators & Advanced Trading Systems module in the SkyPress Forex Academy.
Chart Analysis Across Different Trading Styles
Chart analysis is not limited to one trading style. Day traders, swing traders, and longer-term traders can all use technical analysis, although their timeframe, entry criteria, and risk-management approach may differ.
Day Trading
Day traders generally focus on shorter-term price movements and may use intraday charts to identify opportunities. Because shorter timeframes can contain more noise, disciplined execution and risk control are particularly important.
Swing Trading
Swing traders generally attempt to capture larger price movements that may last several days or weeks. Higher timeframes such as four-hour and daily charts can therefore become particularly useful.
Longer-Term Analysis
Longer-term traders may place greater emphasis on weekly and monthly charts. These charts can help identify major market trends and significant historical price zones.
How to Avoid Common Chart-Reading Mistakes
Many trading mistakes come not from a lack of technical knowledge, but from misinterpreting information or abandoning a trading plan.
- Overtrading: Taking too many trades simply because the chart is available.
- Ignoring the higher timeframe: Focusing on a small chart without considering the broader trend.
- Chasing price: Entering after a large move because of fear of missing out.
- Indicator overload: Using too many tools that provide overlapping or conflicting signals.
- Moving stop-losses emotionally: Changing risk parameters simply because a trade is moving against you.
- Ignoring market conditions: Using a trend strategy during a ranging market or a range strategy during a strong trend.
A Simple Professional Chart Checklist
Before considering a trade, a trader can use a simple checklist to bring consistency to the analysis process.
✓ Identify the higher-timeframe direction.
✓ Determine whether the market is trending or ranging.
✓ Mark major support and resistance zones.
✓ Identify important swing highs and swing lows.
✓ Study current price action.
✓ Look for confirmation rather than forcing a setup.
✓ Define the entry and invalidation point.
✓ Calculate the potential risk before entering.
The purpose of this checklist is not to guarantee profitable trades. Instead, it helps transform chart analysis into a repeatable decision-making process.
Turning Chart Analysis Into a Trading Setup
Reading a chart is only the first step. The next challenge is converting the information on the chart into a structured trading plan. A good setup should explain why the trade is being considered, where the entry could occur, where the idea becomes invalid, and where profits could potentially be taken.
This prevents traders from entering positions simply because price appears to be moving quickly. Instead, every trade is based on a predefined scenario.
Step 1: Establish Market Context
Begin by identifying the broader market condition. Determine whether the market is trending upward, trending downward, or moving within a range.
Next, identify the most important support and resistance zones. These areas can provide context for evaluating potential entries and exits.
Step 2: Wait for Price to Reach an Area of Interest
Rather than chasing price in the middle of a large movement, traders can wait for price to approach a previously identified area of interest.
An area of interest could include support, resistance, a previous swing point, a breakout level, or another location identified by the trader’s strategy.
Step 3: Look for Price-Action Confirmation
Once price reaches an important area, traders can observe how the market reacts. Potential evidence may include rejection candles, engulfing patterns, momentum changes, or a shift in short-term market structure.
Confirmation does not eliminate risk. It simply provides additional information before a trading decision is made.
Entries, Stop-Losses and Profit Targets
Every trading setup should have clearly defined parameters before the order is placed. Three of the most important are the entry, stop-loss, and profit target.
Entry Price
The entry is the price at which a trader opens a position. Depending on the strategy, an entry may occur after a breakout, during a pullback, after a rejection, or following confirmation of a structural change.
Stop-Loss
A stop-loss is an order designed to limit the loss if the market moves against the trading idea.
The location of a stop-loss should be connected to the logic of the setup. It should not simply be placed at an arbitrary number of pips because the trader wants to risk a specific amount.
Profit Target
A profit target is a predefined area where the trader may consider closing some or all of the position.
Potential targets can be based on previous swing highs, swing lows, support, resistance, measured price movements, or another objective feature of the trading strategy.
Understanding Risk-to-Reward Ratio
Risk-to-reward ratio compares the amount a trader is willing to risk with the potential return of a trade.
For example, if a trader risks $50 on a setup and has a potential profit target of $100, the trade has a potential risk-to-reward ratio of 1:2.
Risk-to-reward should not be used as a reason to enter a poor-quality setup. A trade with an attractive mathematical ratio can still fail if the underlying market analysis is weak.
Important: A favorable risk-to-reward ratio does not guarantee profitability. Traders must consider the probability and quality of the setup as well as the potential return.
Understanding Confluence in Technical Analysis
Confluence occurs when several independent pieces of technical information support the same trading idea.
For example, a trader may identify a daily support zone, an established bullish market structure, and a bullish price-action formation on a lower timeframe. Together, these factors may provide stronger context than any single signal.
Possible sources of confluence include:
- Higher-timeframe market structure
- Support and resistance
- Trend lines
- Price-action patterns
- Moving averages
- Momentum indicators
- Breakout and retest behavior
- Important psychological price levels
Confluence should improve the quality of analysis, not become an excuse to keep adding indicators until a trade appears attractive.
Breakout and Retest Strategy
One common chart-analysis approach involves waiting for price to break an important level and then observing whether that level is successfully retested.
For example, price may break above resistance and move higher. Instead of immediately entering after the initial movement, a trader may wait to see whether price returns to the former resistance area.
If the previous resistance begins acting as support and price produces bullish confirmation, the trader may consider the situation more favorable than entering without waiting for the retest.
The same concept can occur in reverse when price breaks below support and later tests that area as potential resistance.
Identifying False Breakouts
False breakouts are one of the most common challenges when trading support, resistance, and chart patterns.
A false breakout occurs when price moves beyond a significant level but fails to maintain the move and returns inside the previous range.
These situations can trap traders who enter too quickly. Studying candle closes, market structure, momentum, and retests can help traders make more informed decisions.
However, there is no method that can identify every false breakout in advance. Risk management remains essential.
Chart Analysis and Trading Psychology
Technical knowledge alone does not make a successful trader. Psychology plays an equally important role because traders must make decisions while dealing with uncertainty, losses, impatience, and changing market conditions.
Fear can cause traders to exit good positions too early. Greed can encourage excessive position sizes. Fear of missing out can lead to entering trades after a major move has already occurred.
A structured chart-analysis process can reduce some of these emotional reactions because decisions are made according to predefined rules rather than temporary feelings.
Discipline principle: Your trading plan should determine when you enter, where you exit, and how much you risk. Your emotions should not rewrite the plan after the trade begins.
Keeping Your Forex Charts Clean
A professional chart does not necessarily need dozens of indicators, trend lines, boxes, arrows, and labels. Too much information can make important price structures harder to recognize.
Start with the basics: price, market structure, support and resistance, and timeframe. Add indicators only when they provide information that supports the strategy.
The objective is to create a chart that makes decision-making clearer rather than more complicated.
Practical Forex Chart Analysis Example
Imagine that EUR/USD is trading in a broader uptrend. The daily chart shows higher highs and higher lows, while an important support zone has formed around a previous swing low.
Price eventually pulls back toward that zone. Instead of buying immediately, the trader waits to observe the reaction.
A bullish rejection candle then appears, followed by a move above a short-term swing high. This combination provides several pieces of information: the broader trend is bullish, price has reached an important area, sellers failed to maintain lower prices, and short-term structure has shifted upward.
The trader can then define the potential entry, invalidation point, target, and position size before deciding whether the setup meets the trading plan.
Why No Chart Pattern Is Guaranteed
Forex markets are influenced by many factors, including economic data, interest-rate expectations, geopolitical developments, liquidity conditions, and changes in market sentiment.
Consequently, even a technically attractive setup can fail.
Professional trading is therefore not about finding a pattern that never loses. It is about developing a repeatable process in which losses are controlled and trading decisions remain consistent.
For a deeper understanding of risk control and trader psychology, continue with Mastering Risk Management and Trading Psychology .
You can also continue through the Advanced Trade Execution and Market Timing Strategies module to learn how chart analysis can be translated into more structured trade execution.
Building a Complete Forex Chart Analysis Workflow
A professional approach to chart analysis should follow a consistent process. Instead of opening a chart and immediately searching for an entry, traders can work from the broad market picture toward the specific trade setup.
This approach helps separate analysis from execution. First determine what the market is doing. Then decide whether current conditions match your strategy. Only after that should you consider an entry.
Step 1: Start With the Higher Timeframe
Begin with a higher timeframe such as the daily or four-hour chart. Look for the dominant market structure and identify the major areas where price has previously reacted.
The objective at this stage is not to find an immediate entry. It is to establish context.
Step 2: Mark Important Price Zones
Identify significant support and resistance areas, previous swing highs and lows, and major consolidation zones.
Avoid marking every minor level on the chart. Too many levels can make the chart confusing and reduce the importance of genuinely significant areas.
Step 3: Move to the Trading Timeframe
After understanding the broader market, move to the timeframe that matches your trading strategy.
A day trader may focus on intraday charts, while a swing trader may rely more heavily on four-hour and daily charts.
Step 4: Wait for Confirmation
When price reaches an important zone, observe its behavior rather than assuming that the level will automatically produce a reversal.
Look for evidence such as rejection, a strong close, a breakout and retest, or a meaningful change in short-term structure.
Step 5: Define the Trade Before Entering
Before placing an order, determine the entry price or entry condition, stop-loss, potential target, and position size.
If the setup cannot be clearly defined, there may be no reason to enter the trade. Sometimes the best trading decision is to remain on the sidelines.
Forex Trading Sessions and Chart Behavior
Forex markets operate across major global financial centers, and trading activity can change as different sessions open and close.
The major sessions commonly discussed by forex traders are the Asian session, European session, and North American session.
Market activity can vary considerably between sessions. Periods with greater participation may produce increased volatility, while quieter periods may produce more limited price movement.
Traders should therefore consider the time of day when interpreting short-term chart behavior.
London Session
The European session is often associated with increased activity in major currency pairs. Price can become more active as European financial centers open and liquidity increases.
New York Session
The North American session can also produce significant price movement, particularly when important economic information is released.
The period when European and North American markets are both active is commonly watched by short-term traders because trading activity can be relatively high.
Asian Session
The Asian session can sometimes display more subdued price action in certain currency pairs, although this varies according to market conditions and economic events.
Understanding Volatility
Volatility refers to the degree and speed of price movement. High-volatility conditions can create larger price swings, while low-volatility environments may produce narrower ranges.
Volatility is neither automatically good nor bad. It simply changes the conditions under which a trading strategy operates.
A trader should understand how increased volatility affects stop-loss placement, position sizing, spreads, and the likelihood of rapid price movement.
Important: A larger price movement does not automatically mean a better trading opportunity. Higher volatility can increase both potential opportunity and potential risk.
How Economic News Affects Chart Analysis
Technical analysis focuses primarily on price, but forex markets can react sharply to economic announcements. Interest-rate decisions, inflation reports, employment data, central-bank statements, and other major releases can create rapid changes in price.
A technical setup that appears attractive shortly before a major announcement may behave very differently once new information reaches the market.
For this reason, traders should know whether significant economic events are scheduled around the time they plan to trade.
Chart analysis should therefore be used alongside awareness of the broader market environment rather than in isolation.
Keeping a Forex Trading Journal
A trading journal can turn chart analysis into a measurable learning process. Instead of relying on memory, traders can record what they saw, why they entered, how the trade was managed, and what happened afterward.
A useful journal can include:
- Currency pair traded
- Date and trading session
- Timeframe used
- Market direction
- Entry reason
- Stop-loss and target
- Risk-to-reward ratio
- Trade outcome
- Screenshot of the chart
- Lessons learned
After recording enough trades, traders can review their results and identify recurring strengths and weaknesses.
Backtesting Forex Chart Strategies
Backtesting involves applying a trading strategy to historical market data to study how it would have performed under predefined rules.
The purpose of backtesting is not to prove that a strategy will work in the future. Instead, it helps traders evaluate whether their rules are clear, consistent, and worth further investigation.
A proper backtest should use specific entry rules, exit rules, risk parameters, and consistent criteria. Changing the rules whenever a trade loses can produce misleading results.
Forward Testing and Demo Trading
After studying historical data, traders can test a strategy in live market conditions using a demo account or another controlled environment.
Forward testing can reveal practical issues that may not become obvious during historical analysis, including execution speed, spreads, slippage, and emotional pressure.
New traders should build experience gradually rather than assuming that success on historical charts automatically translates into live trading performance.
Advanced Chart-Reading Principle: Context Over Signals
One of the most important lessons in technical analysis is that context often matters more than individual signals.
A candlestick pattern, indicator reading, or chart formation should be interpreted within the surrounding market environment.
For example, an engulfing candle at a major support zone within a bullish higher-timeframe structure may provide a different context from the same candle appearing randomly in the middle of a range.
The more complete the context, the more informed the trading decision can become.
Professional mindset: Do not ask, “Is this a buy signal?” Ask, “What is the market structure, where is price located, what is price doing here, and what would invalidate my idea?”
Developing Patience as a Chart Analyst
Not every chart deserves a trade. Sometimes the market is unclear, volatility is unusually high, or price is positioned between important levels without providing a meaningful setup.
Professional traders understand that waiting is part of trading.
A trader who can remain patient until predefined conditions appear may avoid many low-quality trades caused by boredom, fear of missing out, or the desire to remain constantly active.
For a broader understanding of trade execution and timing, continue with Advanced Trade Execution & Market Timing Strategies .
You can also explore Advanced Smart Money Concepts & Trade Execution to deepen your understanding of institutional-style market structure and price behavior.
Practical Rules for Better Forex Chart Analysis
Becoming better at chart analysis does not require predicting every market move. It requires developing a repeatable process and applying the same principles consistently.
1. Always Start With Context
Before looking for an entry, determine the broader market direction and identify the important price zones. A setup without context can easily be misleading.
2. Do Not Chase Price
When price has already made a large movement, entering simply because the market appears to be moving strongly can expose a trader to poor risk-to-reward conditions. Waiting for a pullback or another predefined opportunity can provide better structure.
3. Respect Higher Timeframes
Short-term charts can contain significant noise. Higher-timeframe analysis can help traders understand the larger trend and avoid making decisions based solely on temporary price fluctuations.
4. Keep Your Analysis Simple
A chart filled with indicators does not automatically produce better decisions. Use only the tools that genuinely contribute to your trading methodology.
5. Define Risk Before Entry
Know where the setup becomes invalid and determine the amount you are willing to risk before entering the trade.
Key Takeaways From Forex Chart Analysis
Charts provide context. Use them to understand price behavior rather than attempting to predict every future movement.
Market structure matters. Higher highs and higher lows generally indicate bullish structure, while lower highs and lower lows generally indicate bearish structure.
Levels are zones. Support and resistance should generally be treated as areas of interest rather than perfectly precise prices.
Confirmation matters. A candlestick pattern or indicator should be interpreted within the broader market environment.
Risk comes first. A technically strong setup can still fail, so every trade needs defined risk.
Consistency creates improvement. Use journaling, backtesting, and review to identify what works and what needs to be improved.
Frequently Asked Questions About Forex Chart Analysis
What is forex chart analysis?
Forex chart analysis is the process of studying currency-price movements to identify trends, market structure, support and resistance, momentum, patterns, and potential trading opportunities.
Which chart is best for forex trading?
Candlestick charts are widely used because they display the open, high, low, and close of each period while making price behavior easy to interpret. However, the most appropriate timeframe depends on the trader’s strategy.
What is the most important part of chart analysis?
There is no single element that guarantees better results. Market structure, price location, trend, support and resistance, confirmation, and risk management should be considered together.
Can technical analysis predict forex prices?
No. Technical analysis cannot predict future prices with certainty. It provides a framework for evaluating probabilities and identifying potential scenarios.
How many indicators should a forex trader use?
There is no universal number. Many traders prefer a small number of complementary tools rather than filling the chart with indicators that provide overlapping information.
Is support and resistance reliable?
Support and resistance can be useful reference areas, but neither guarantees a reversal. Price can break through important levels because market conditions can change rapidly.
What timeframe should beginners use?
Beginners can benefit from studying higher timeframes because they generally provide a clearer view of broader price structure. The appropriate timeframe ultimately depends on the individual’s trading strategy and objectives.
What is a false breakout?
A false breakout occurs when price moves beyond an important level but fails to maintain the move and returns toward the previous trading range.
Can chart analysis guarantee profitable trades?
No. No technical method can guarantee profits. Forex trading involves uncertainty, and losses are possible even when analysis and execution are disciplined.
How can I improve my chart-reading skills?
Practice identifying market structure, support and resistance, trends, and candlestick behavior. Keeping a trading journal and reviewing historical charts can also help develop consistency.
Conclusion: Becoming a More Disciplined Chart Analyst
Forex chart analysis is much more than recognizing candlestick patterns or adding technical indicators to a trading platform. It is a structured process of understanding price, market structure, momentum, important levels, and risk.
The strongest chart-reading skills develop through practice and repetition. Traders should learn to identify the broader market environment before focusing on individual entries.
A professional approach also accepts that uncertainty is unavoidable. Even a well-researched setup can fail. The objective is therefore not to eliminate losses but to control risk and make decisions according to a consistent process.
As you continue through the SkyPress Forex Academy, connect the principles in this module with technical indicators, risk management, trade execution, and advanced market-structure concepts.
Forex and CFD trading involves substantial risk of loss and may not be suitable for every investor. Leverage can magnify both profits and losses. The educational information provided by SkyPress is for general educational purposes and should not be considered financial, investment, or trading advice. Always conduct your own research, understand the risks involved, and consider seeking advice from a qualified financial professional where appropriate.